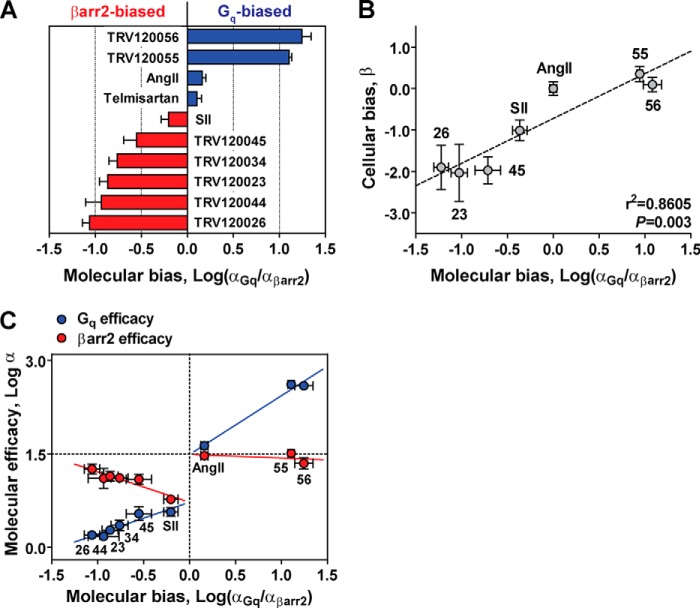
FIGURE 6.
Investigating biased agonism at the level of the LRT ternary complex. A, bias factors (log(αGq/αβarr2)) calculated from molecular efficacies at AT1R-Gq (αGq) and AT1R-βarr2 (αβarr2) fusion proteins. Positive bias values (blue) denote Gq-biased molecular efficacies, whereas negative values (red) denote βarr2-biased molecular efficacies. B, correlation analysis of molecular bias values calculated in vitro (Log(αGq/αβarr2) relative to AngII) and bias values calculated in cells (β) according to the operational approach of Rajagopal et al. (17). Bias at the level of transducer-specific molecular efficacies was significantly correlated with cellular indices of bias (r2 = 0.8605, p = 0.003 by two-tailed Pearson correlation), suggesting that biased molecular efficacies generate signaling bias in cells. Data represent the mean ± S.E. of at least three independent experiments. C, plotting molecular efficacy at each transducer (log αGq and log αβarr2) versus the molecular bias between transducers (log αGq/αβarr2)) uncovers a potential mechanism for generating bias at the AT1R. βarr2-biased ligands (lower left) and Gq-biased ligands (upper right) clustered according to their transducer preferences. Trends in the vertical distances between log αGq (blue) and log αβarr2 (red) suggest that βarr2 bias arises from a reciprocal loss in Gq molecular efficacy and gain in βarr2 efficacy, whereas Gq bias results from an increase in Gq molecular efficacy with no concomitant loss in βarr2 efficacy.

