
FIGURE 8.
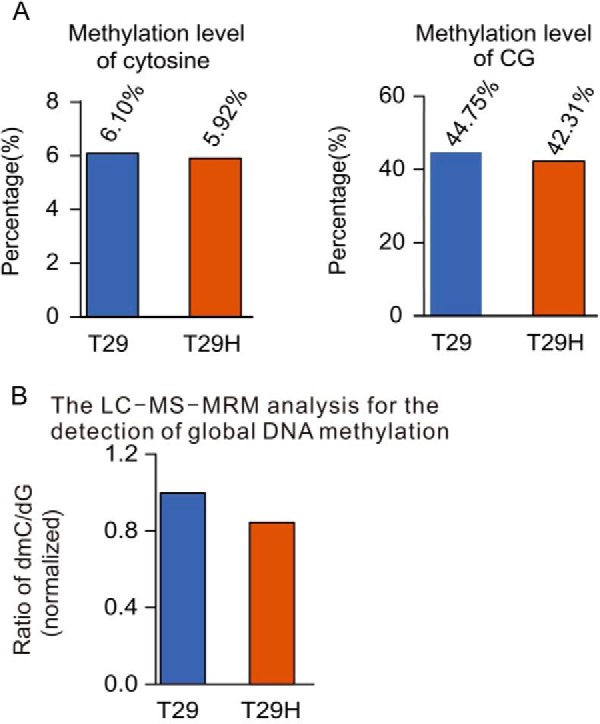
Genomic landscape of DNA methylation in T29 and T29H determined by RRBS-seq. A, the overall methylated level of C and CG in T29 and T29H. B, global DNA methylation analysis of methylated level in T29 and T29H using the LC-MS/MS method.
Official websites use .gov
A
.gov website belongs to an official
government organization in the United States.
Secure .gov websites use HTTPS
A lock (
) or https:// means you've safely
connected to the .gov website. Share sensitive
information only on official, secure websites.
Genomic landscape of DNA methylation in T29 and T29H determined by RRBS-seq. A, the overall methylated level of C and CG in T29 and T29H. B, global DNA methylation analysis of methylated level in T29 and T29H using the LC-MS/MS method.