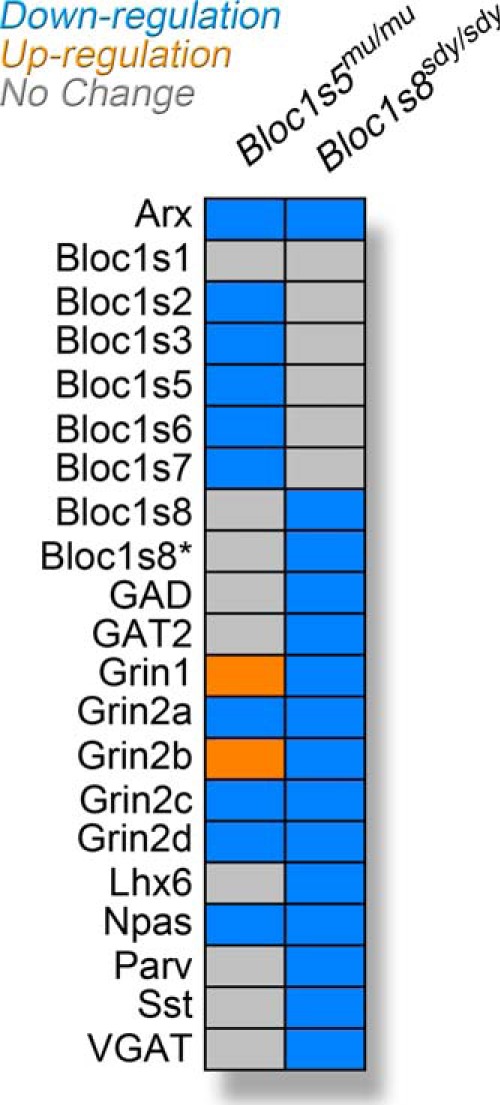
FIGURE 8.

Summary of transcriptional phenotypes in Bloc1s8sdy/sdy and Bloc1s5mu/mu brains. Diagram depicts the transcriptional phenotypes in BLOC-1 null brains. Bloc1s8* denotes the putative dysbindin 1C transcript bSept07. Colored boxes depict no changes (gray), down-regulation (blue), or up-regulation (orange) as compared with wild type C57BL/6J tissue.
