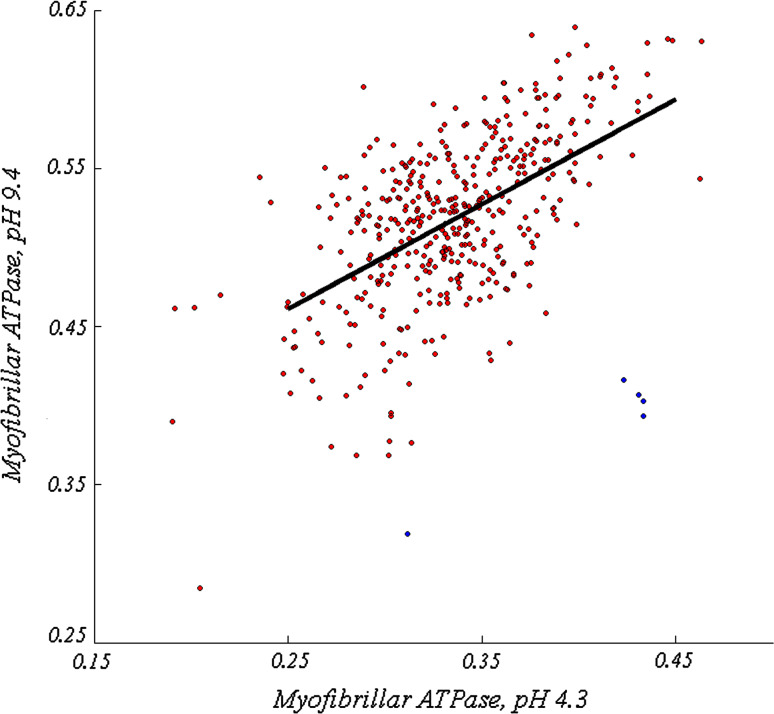
Fig. 6.
Scatter plot of mean pixel intensities for each of the 426 selected fibers after preincubation at pH 4.3 (abscissa) and pH 9.4 (ordinate). Red points correspond to putative type 1 fibers and blue points correspond to putative type 2 fibers. The linear regression line of all data points is shown in black. Putative type 2 fibers were selected on the basis of their distance from the regression line, consistent with the observation that type 2 fibers are considerably lighter at pH 4.3 and darker at pH 9.4

