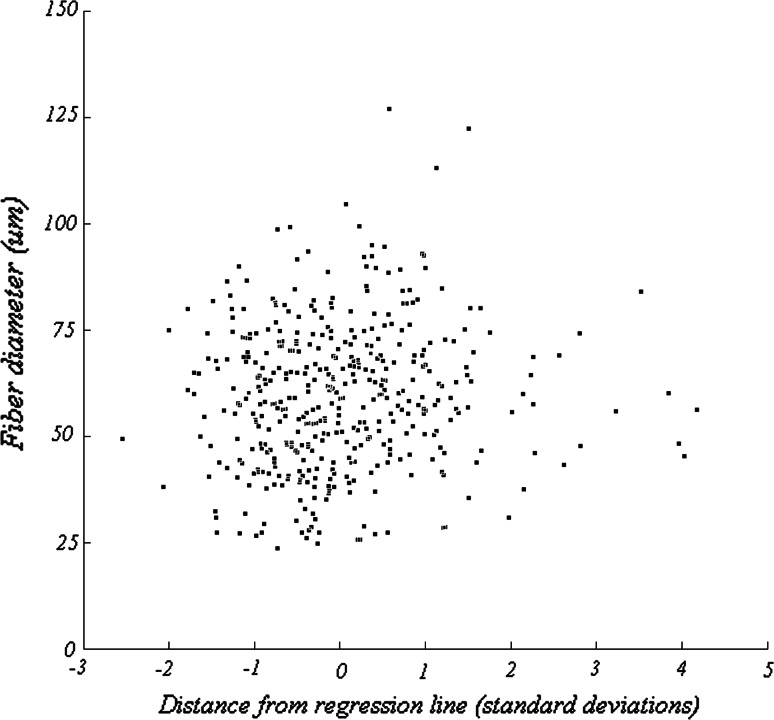
Fig. 9.
Fiber diameter as a function of the distance from the regression line, shown in Fig. 6, expressed in units of standard deviation. This distance metric is used to assess the relative staining intensities produced as a result of preincubation at pH 4.3 and pH 9.4. Positive values correspond to fibers that are more lightly stained in pH 4.3 preparations and more darkly stained in pH 9.4 preparations. The most positive values likely correspond to type 2 fibers. These data reveal that fiber diameter is independent of the relative staining intensities observed in the population

