
Figure 2.
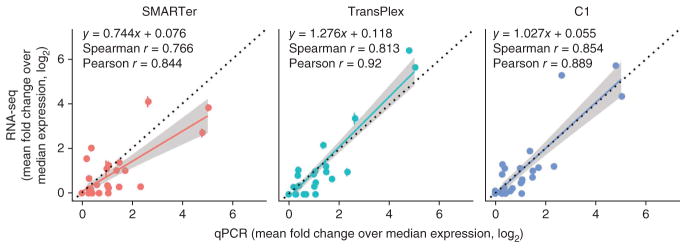
Correlation between single-cell RNA-seq and single-cell multiplexed qPCR for each sample preparation method. Correlation coefficients were computed from log2- transformed values. A linear regression line (color) and the y = x line (black, dotted) are also shown in each panel. Shading represents the 95% confidence interval for each regression line. For RNA-seq data, FPKM values for each of gene of interest were normalized to the median FPKM for each cell and log2 transformed. For qPCR data, threshold cycle (Ct) values for each gene of interest were normalized to the median Ct value for each cell (ΔCt), which also represents a fold change over the median expression. ΔCt values are already in log2 space and were directly plotted. Error bars, standard error (n values as in Fig. 1a).