Figure 3.

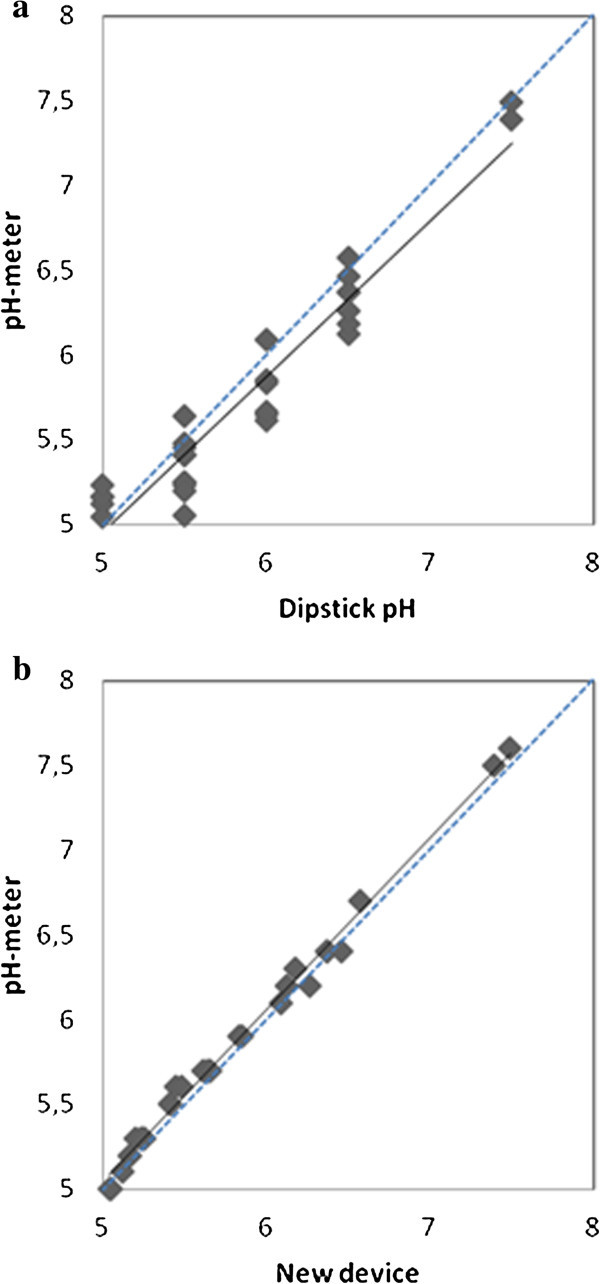
Scatter graphs showing the correlation of pH measurements between pH meter and the dipstick (3a) and the new device (3b) in fresh urine. The regression line is illustrated by a solid line, while the unity line is shown in dotted.

Scatter graphs showing the correlation of pH measurements between pH meter and the dipstick (3a) and the new device (3b) in fresh urine. The regression line is illustrated by a solid line, while the unity line is shown in dotted.