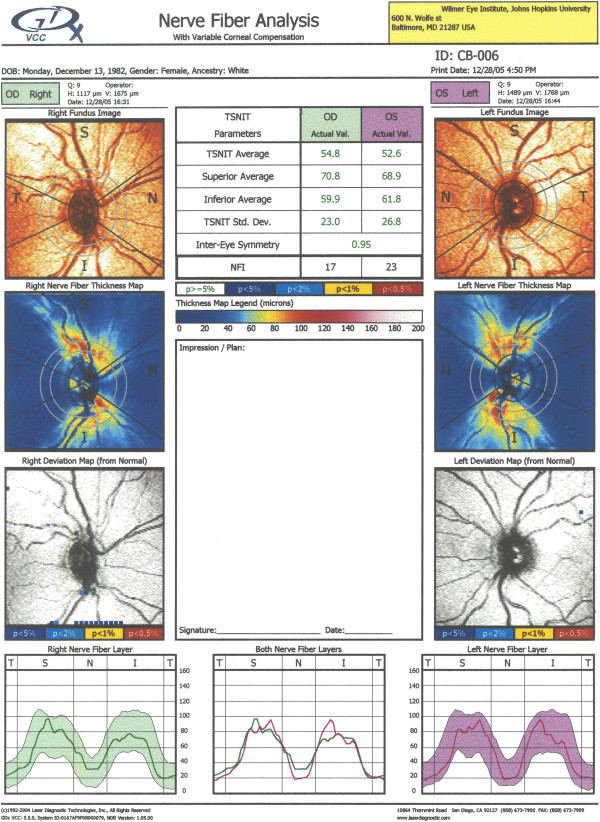
Figure 9.
GDxVCC – exam printout of a normal subject. Key elements: a) the fundus image (top row; useful to check for image quality); b) the thickness map (second row) showing the thickness of the RNFL on a scale of 0 (dark blue) to 120 μm (red), with yellow-red colors for a healthy eye; c) the deviation maps (third row) revealing the location and severity of RNFL loss over the thickness map in serial comparison of thickness maps; d) the Temporal-Superior-Nasal-Inferior-Temporal (TSNIT) maps (bottom row), displaying the thickness values along the calculation circle starting temporally and moving superiorly, nasally, inferiorly and ending temporally, along with the shaded areas representing the 95% normal range for the patient’s particular age. The printout also includes parameters, such as the TSNIT average, Superior average, Inferior average, TSNIT standard deviation and Inter-eye Symmetry.

