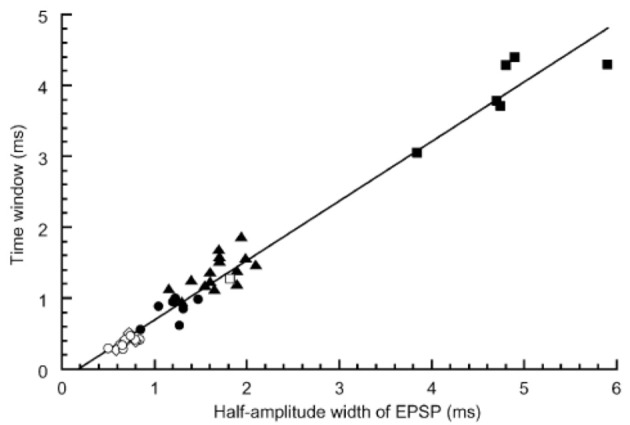
Figure 3.

Correlation between the time window for coincidence detection and the width of EPSP measured in the NL neurons. Time windows were plotted against the half amplitude width of EPSP recorded at −62 mV. Different symbols indicate different experimental conditions: ▪, embryo recorded at 20–25°C (n = 6); □, embryo 40°C (n = 1); ▴, chick 20–25°C (n = 15); ●, chick 30°C (n = 7); ○, chick 40°C (n = 8); ◊, chick 40°C without bicuculline using low-Cl internal solution (n = 5). Reproduced with permission from Kuba et al. (2003).
