
Figure 4.
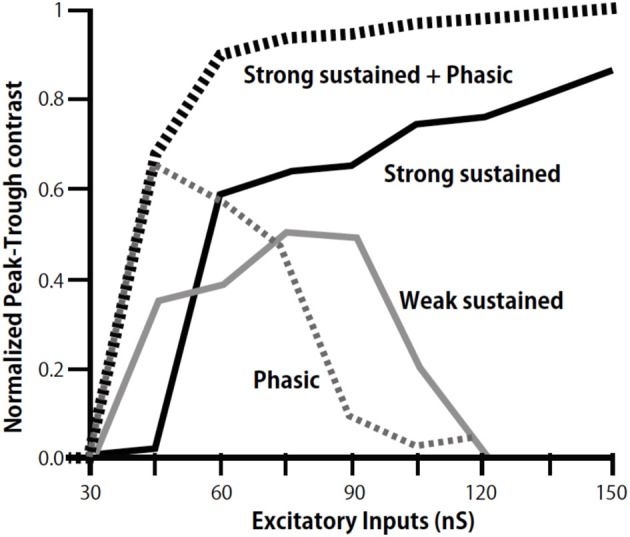
Modulation of peak-trough contrast of ITD tuning curve of low-CF NL neurons by inhibition. Peak-trough contrasts of ITD tuning curve are calculated by including the sustained inhibition of weak (gray line), strong (black line), and phasic inhibition (dotted gray line) separately, and by including both the strong sustained and the phasic inhibition (dotted black line). Modified from Yamada et al. (2013).