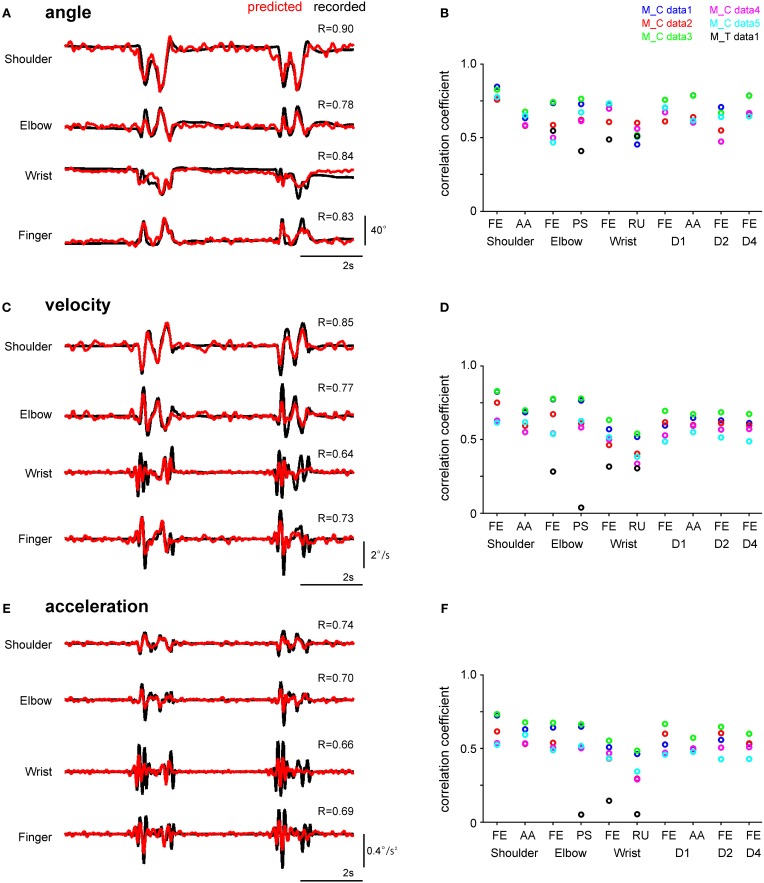
Figure 2.
Performance of the SLiR model in predicting joint kinematics from DRG ensemble activity during reach-to-grasp movements. (A,C,E) Examples of recorded kinematics of the shoulder, elbow, wrist, and finger (digit 2 MCP) joints of Monkey C (black line) and their prediction using the SLiR model (red line). The correlation coefficient (R) between the recorded and predicted kinematics is shown in the upper right corner of each trace. The angular changes at the joints are shown in (A), velocity in (C), and acceleration in (E). (B,D,F) Test performance (correlation coefficient: R) of the SLiR model in predicting the kinematics of the forelimb joints. The indicated values are averages of the results of 5 or 6 pairs of training and test data sets from each session. The angular changes at the joints are shown in (B), velocity in (D), and acceleration in (F). FE, flexion/extension; AA, adduction/abduction; PS, pronation/supination; RU, radial/ulnar.

