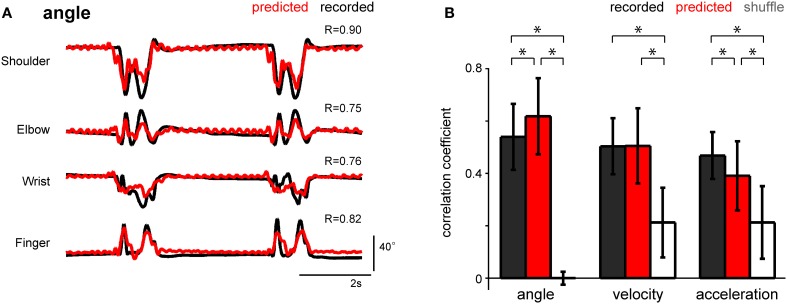
Figure 7.
Performance of the SLiR model in predicting joint kinematics from the predicted DRG neuronal ensemble activity. (A) Examples of recorded kinematics from the shoulder, elbow, wrist, and finger (digit 2 MCP) joints (black) and their prediction from DRG activity using the SLiR model (red). The correlation coefficient (R) between the recorded and predicted kinematics is shown in the upper right corner of each graph. (B) Test performance [correlation coefficient (R)] of the SLiR model in predicting the kinematics of the forelimb joints from the recorded (black), predicted (red), and shuffled (white) activity. The indicated values are the average results from 6 sessions and the error bars represent the standard deviation (n = 274 data sets). The asterisks indicate significance [paired Student's t-test with Bonferroni correction (n = 3), p < 0.0001].

