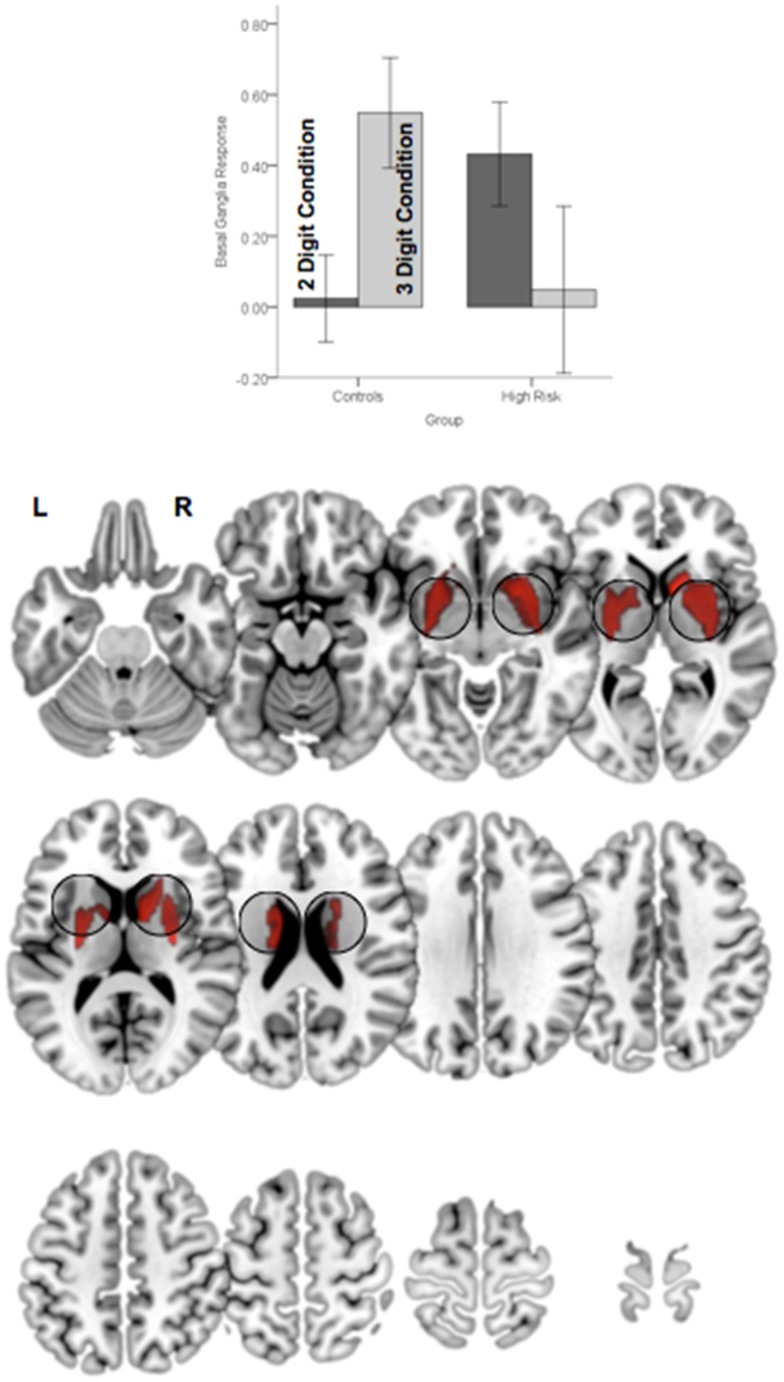
Figure 6.
Significant clusters (p < 0.05, cluster level) under the group × attention demand interaction term are rendered on an ascending mosaic of axial views. As seen in the graph, the interaction was driven by increased engagement with demand in controls, but decreased engagement in high-risk subjects. By implication, the BG, a core region in the executive attention circuit, appears to “turn off” in risk subjects with an increase in attention-related demand.

