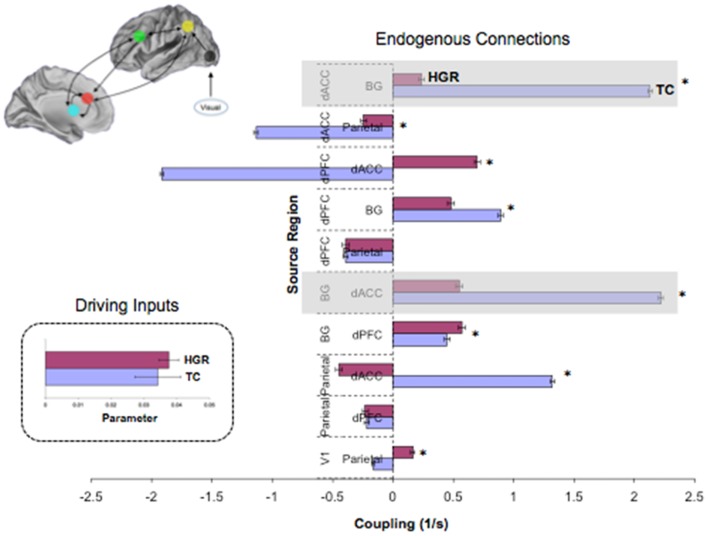
Figure 8.
Endogenous connections and driving inputs in TC and HGR. Bayesian parameter averages over all subjects in the winning model (Figure 7 reproduced here) are depicted for each connection and for each of TC and HGR (± posterior standard errors). For the graph depicting endogenous connections, the source regions are vertically labeled and the target regions are horizontally labeled. TC and HGR reveal a mixture of positive and negative coupling across the modeled network. The shaded areas draw attention to highly significant hypo-connectivity in the bilateral dACC–BG sub-circuit in HGR subjects. The negative/inhibitory dPFC coupling in TC may reflect competitive inhibition between frontal regions most associated with cognitive control, and is absent in HGR. The inset depicts driving inputs to the primary visual cortex (not different between TC and HGR). Despite model evidence suggestive of identical model structures, these data suggest that HGR are characterized by disordered effective connectivity in the modeled sustained attention network.

