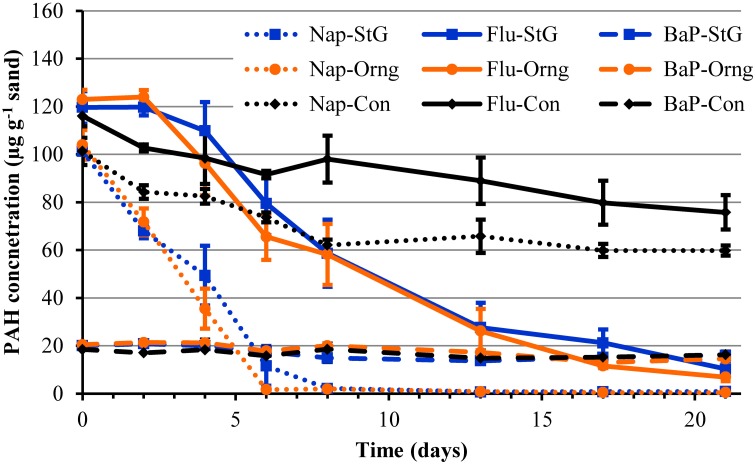
Figure 3.
Measured PAH concentrations in mesocosm columns containing sand from the oil impacted beach, Orange, and the non-impacted beach, St. George, over time. The sand was spiked with a mixture of 100 μg g−1 naphthalene, 120 μg g−1 fluorene, and 20 μg g−1 benzo[α]pyrene prior to column setup. Lines in blue represent St. George (StG) sand mesocosm samples, lines in orange represent Orange (Orng) beach, and black lines represent control abiotic columns (Con). Solid lines represent fluorene (Flu) concentrations, dotted lines represent naphthalene (Nap) concentrations, and the dash line represents benzo[α]pyrene (BaP).

