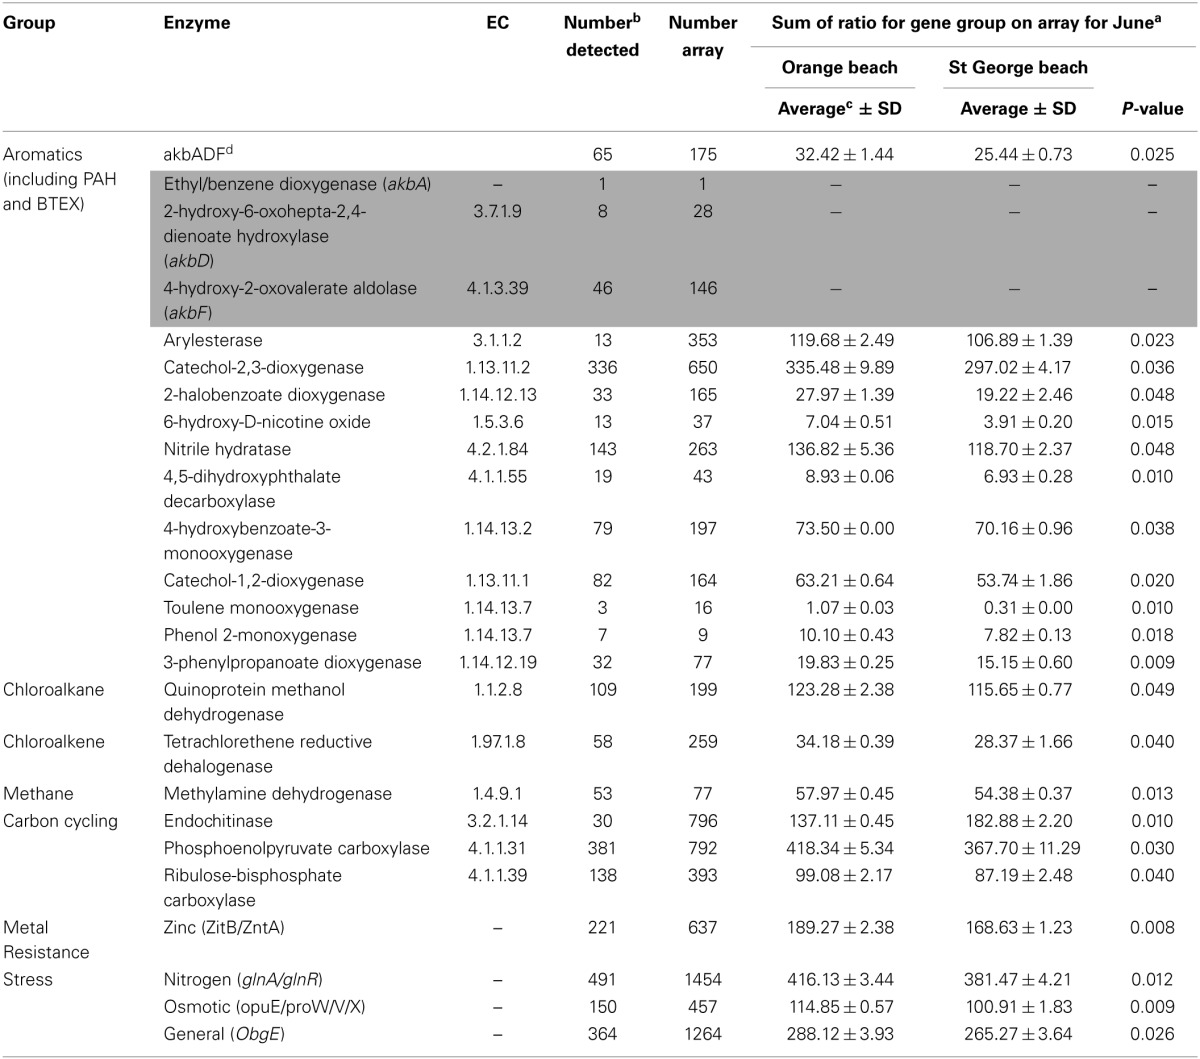
Table 2.
Individual genes showing a significant increase (p < 0.05) at oil-impacted Orange beach compared to non-impacted St. George beach during the month of June.

aAverage of the sum of the ratio between the gene variant spot fluorescence and average spot fluorescence on the microarray.
bTotal number of gene variants detected (regardless of site) and used to generate the sum.
cAverage of sum from two independent microarrays from samples 100 m apart at same beach.
dAverage of the sum of the ratios of gene groups akbA, akbD, and akbF (shaded in gray).
