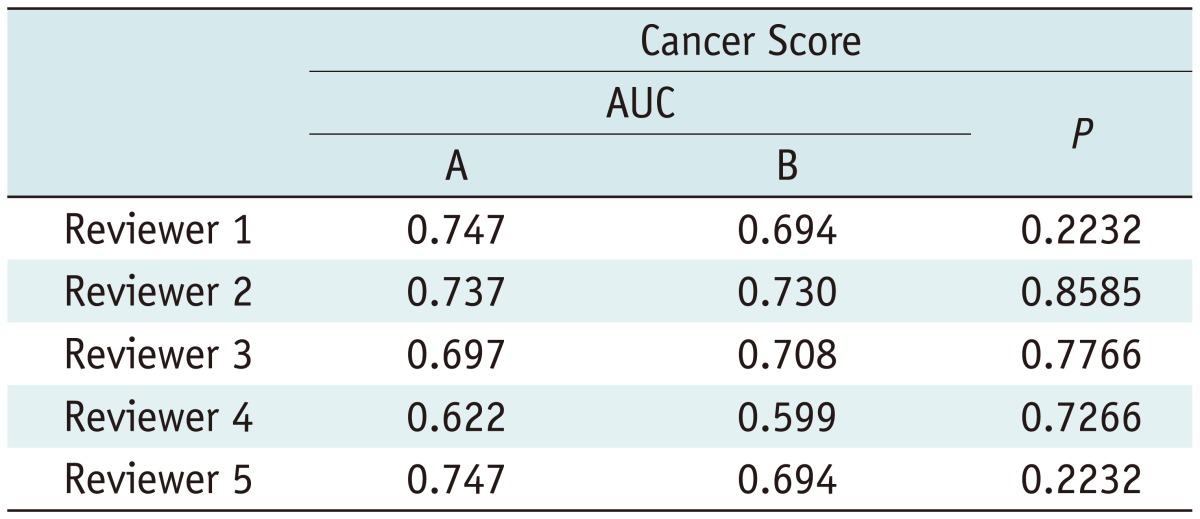
Table 4.
Comparison of Diagnostic Performance

Note.-A = specimen mammography A, AUC = area under the receiver operating characteristic curve, B = specimen mammography B
Comparison of Diagnostic Performance

Note.-A = specimen mammography A, AUC = area under the receiver operating characteristic curve, B = specimen mammography B