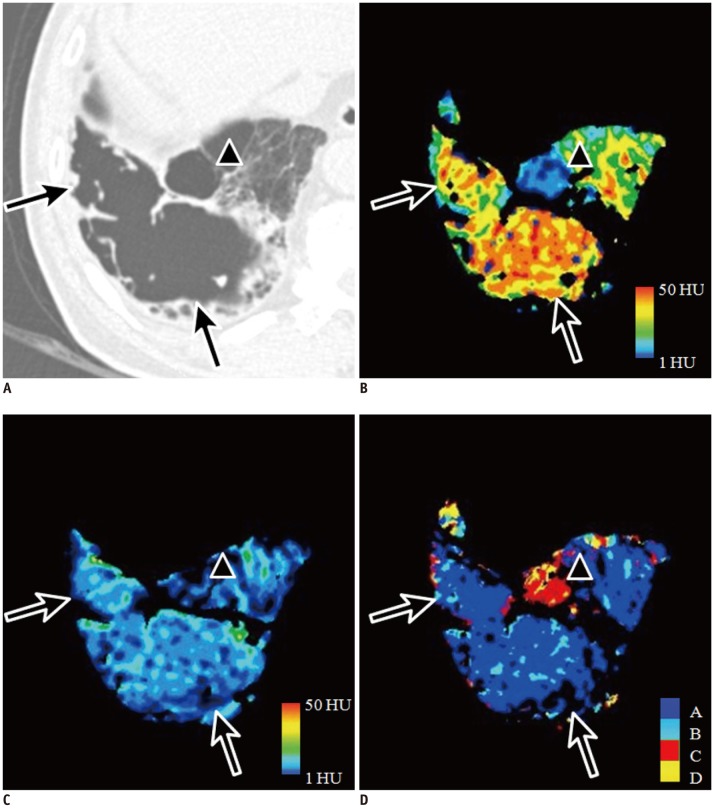
Fig. 5.
Representative images of patterns A and C for structural abnormalities in 64-year-old male with Gold stage I emphysema.
Large subpleural bulla in right basal lung on CT (A; arrows) shows high attenuation on wash-in xenon-enhanced image (B) and iso-attenuation on wash-out xenon-enhanced image (C). This ventilation pattern is compatible with pattern A shown on CAC map in blue (D). Small subpleural bulla anterior to large bulla on CT (A; arrowhead) shows low attenuation on wash-in (B) and wash-out xenon-enhanced images (C). This ventilation pattern is in agreement with pattern C and is correctly visualized on CAC map in red (D). CAC = computer-aided classification

