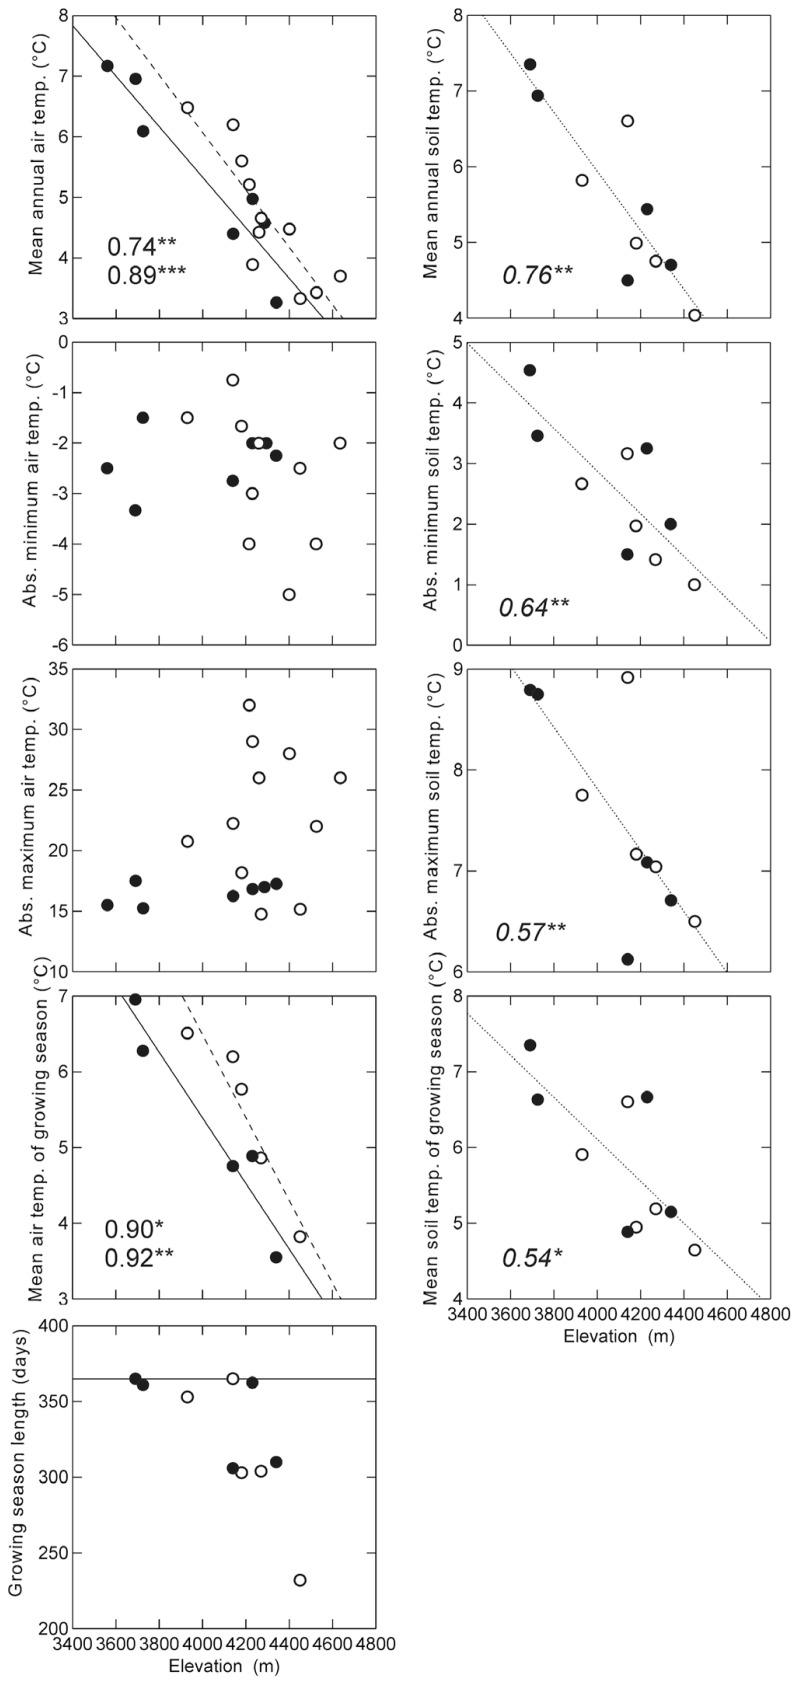
FIGURE 4.
Relationships of measured climatic variables to elevation along the dry (open symbols, dashed lines) and humid (closed symbols, continuous lines) slopes. Growing season length was defined as the number of days with soil temperatures at 10 cm depth consistently above 3.2°C following Körner and Paulsen (2004). Lines show significant linear regression trend lines, numbers indicate the R2 values of the regression analyses (top: dry slope; bottom: humid slope). For soil temperatures, regression lines were drawn and calculated combining data from both slopes. In the graph of the growing season length, the horizontal line represents the maximum possible number of days (365) *p < 0.05; **p < 0.01; ***p < 0.001.

