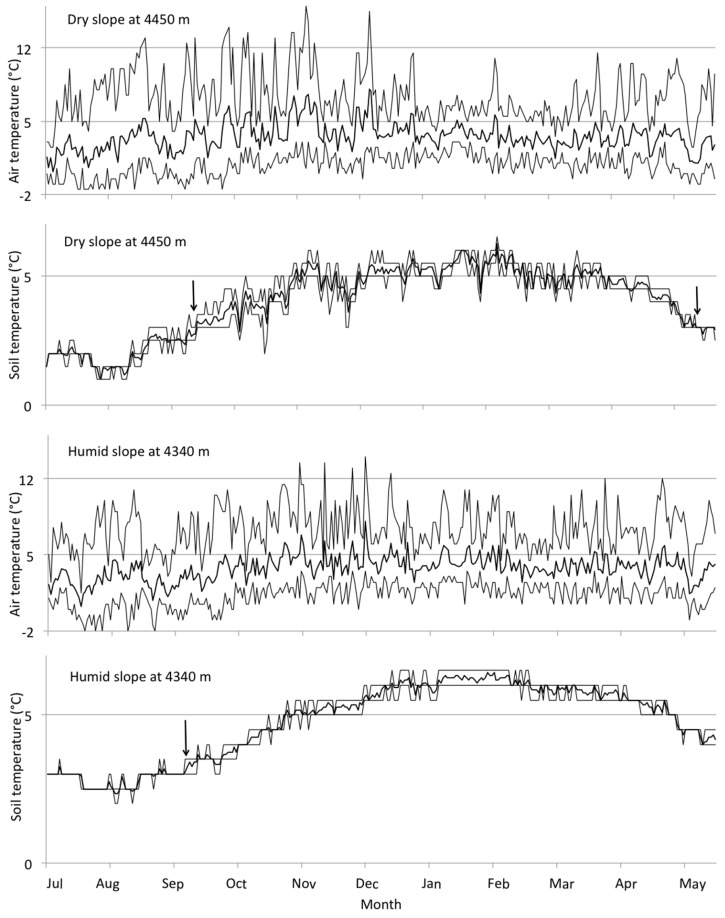
FIGURE 5.
Seasonal variation in air and soil temperatures at the highest sites in dry and humid areas in 2007–2008. Solid lines in the middle indicate daily mean temperatures and dashed lines above and below indicate daily minimum and maximum temperatures. The beginning and the end of the growing season, based on the criteria by Körner and Paulsen (2004), is indicated with arrows. Data from June is missing, and consequently the indication of the end of the growing season at the humid site.

