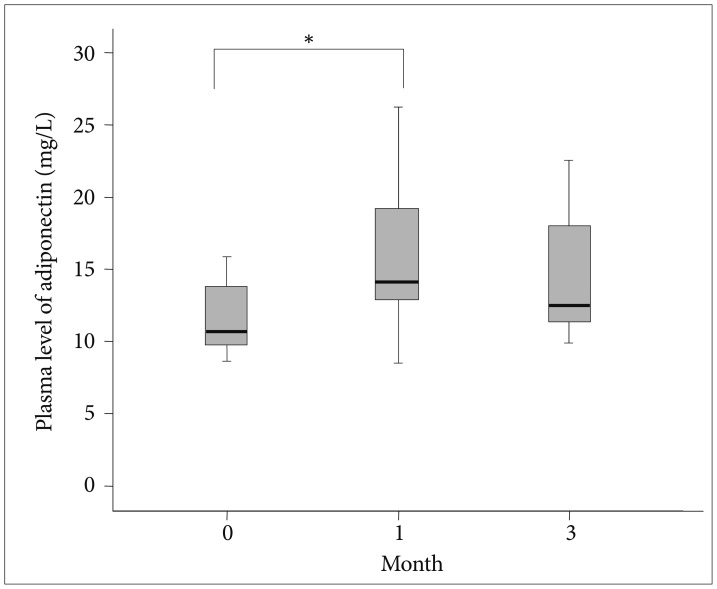
Figure 1.
The box plots show the median and quartiles, and the whisker caps of the box plots show the mean 5th and 95th percentile values. *indicates statistical significance (p<0.05). A Wilcoxon signed rank test yielded the results. The plasma levels of adiponectin at baseline, 1 month, and 3 months were 11.9±5.2, 16.0±5.1, and 14.7±4.5 mg/L, respectively. The mean plasma adiponectin levels were increased between baseline and 1 month (z=-2.401, p=0.016), but decreased from month 1 to 3 months (z=-0.801, p=0.423).

