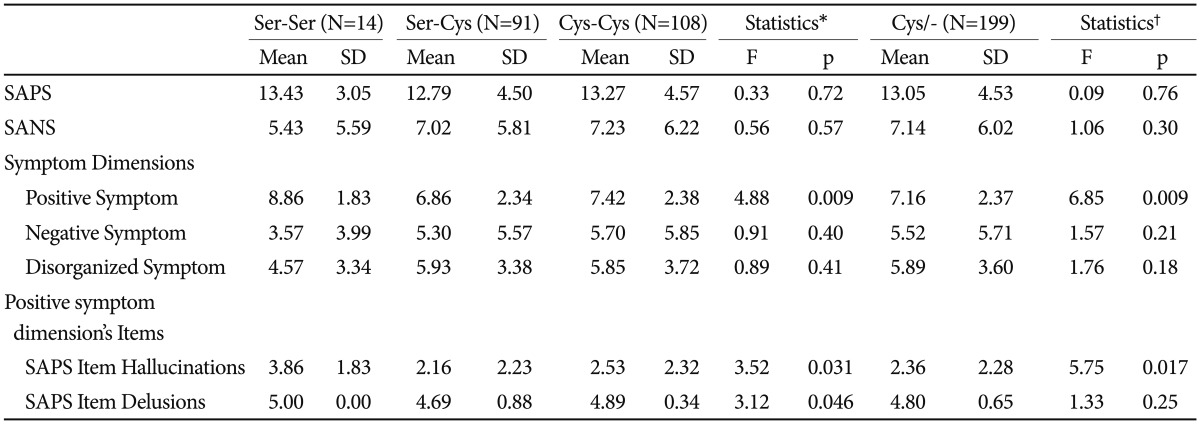
Table 2.
Baseline clinical severity

Statistical significance p<0.05. *analysis of anova for difference between genotype groups, †analysis of anova for difference between genotype groups (Ser/Ser vs. Cys carriers). SAPS: Scale for the assessment of positive symptoms, SANS: Scale for the assessment of negative symptoms
