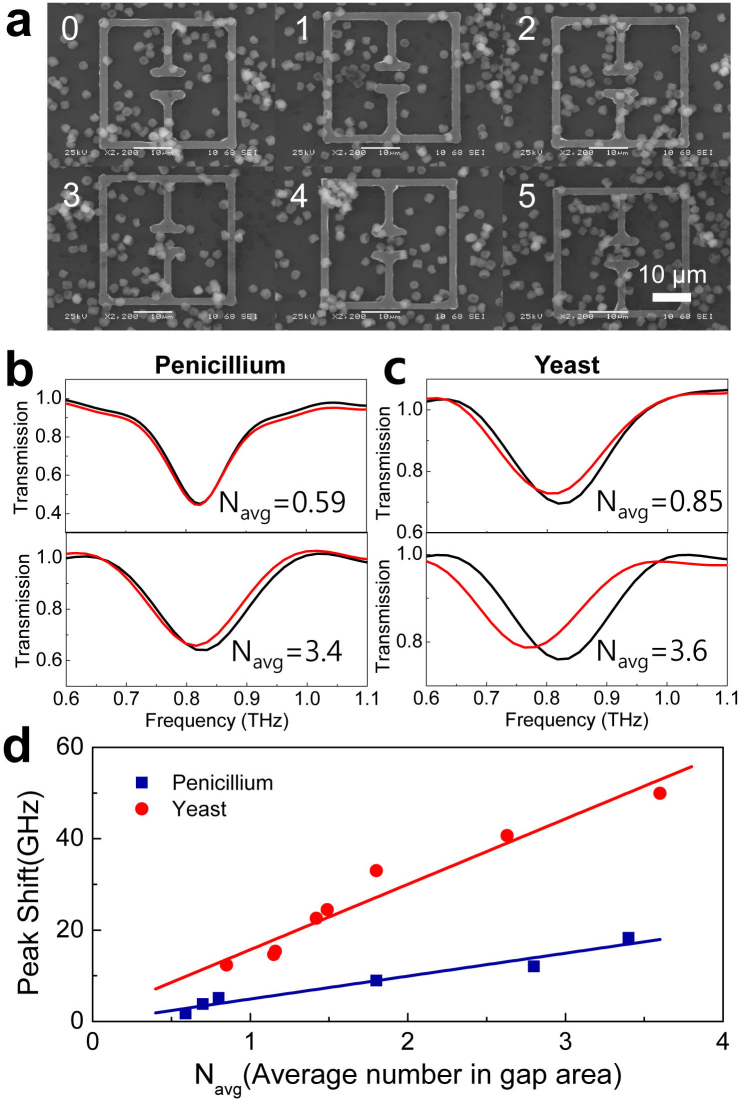
Figure 4. Resonant frequency shift as a function of number density and dielectric constants of fungi.
(a) A series of six SEM images of the metamaterials with the number of penicillia in the gap areas ranging from 0 to 5. (b) THz transmission amplitudes with the penicillia number density of Navg = 0.59 and 3.4, respectively from top to bottom. (c) Same as (b) but with the yeast number density of Navg = 0.85 and 3.6, respectively from top to bottom. (d) A plot of resonant frequency shifts as a function of Navg, for depositions of penicillia (blue boxes) and yeasts (red circles). Solid lines are linear fits to the data.

