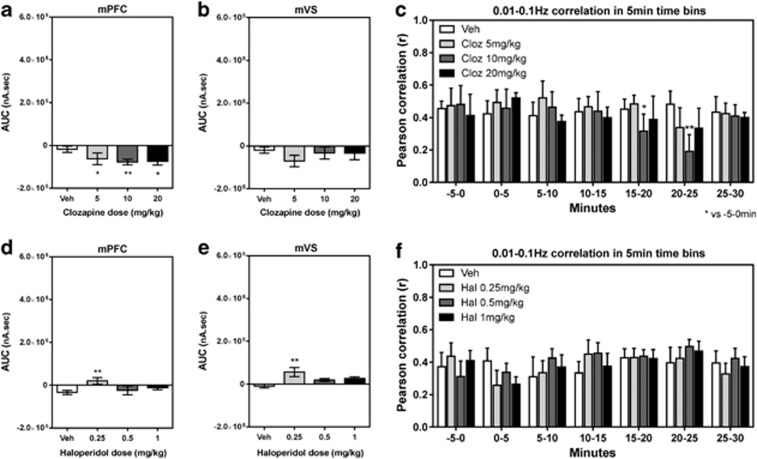
Figure 3.
Clozapine and haloperidol dose response studies. Effect of clozapine injection (5, 10, 20 mg/kg, i.p.) on (a) mPFC (n=6) and (b) mVS (n=6) AUC measures extracted from the O2 response, where bars represent mean (± SEM) AUC for the 1-h period following clozapine injection. (c) Summary of coherence data showing the correlation of the whole frequency range (0.01–0.1 Hz) for each treatment group in 5 min (300 s) time bins (n=5). Bars represent mean (± SEM) Pearson correlation values (r) between 0.01 and 0.1 Hz in 5 min time blocks. The effect of haloperidol injection (0.25, 0.5, 1.0 mg/kg, i.p.) is shown for (d) mPFC (n=7) and (e) mVS (n=6) AUC measures extracted from the O2 response, where bars represent mean (± SEM) AUC for the 1-h period following haloperidol injection. (f) Summary of coherence data showing the correlation of the whole frequency range (0.01–0.1 Hz) for each treatment group in 5 min (300 s) time bins (n=8). Bars represent mean (± SEM) Pearson correlation values (r) between 0.01 and 0.1 Hz in 5 min time blocks. AUC: *p<0.05, **p<0.01, ***p<0.001 vs vehicle; Coherence: RMANOVAs performed on Fisher transformed r-values, *p<0.05, **p<0.01, vs pre-injection baseline.

