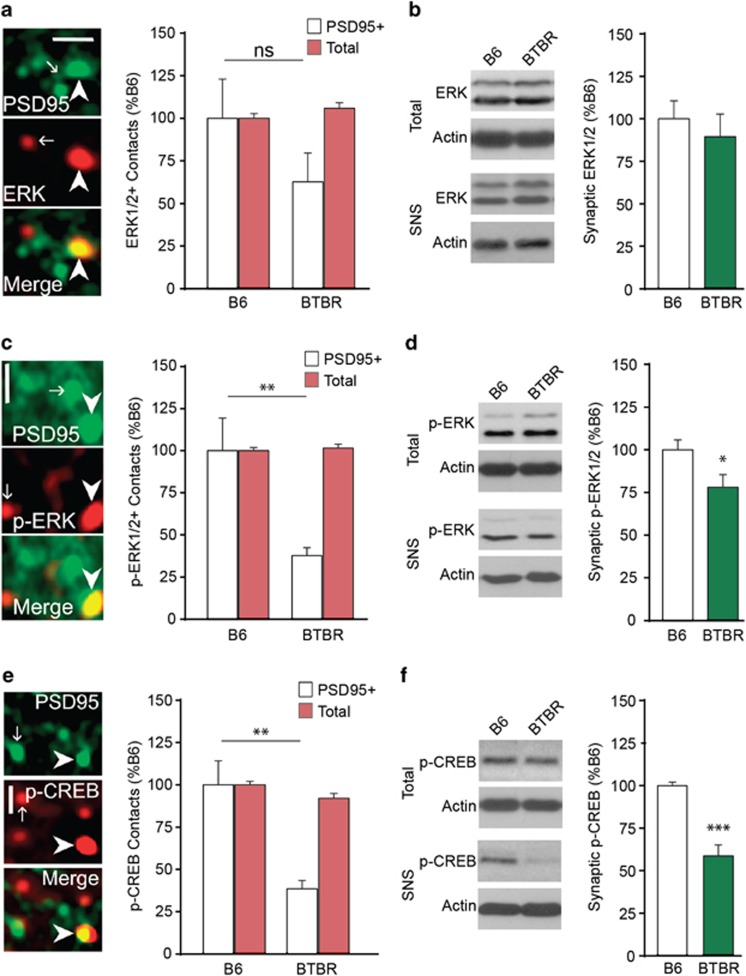
Figure 3.
The number of stratum radiatum PSDs containing activated ERK1/2 is lower in BTBR as compared to B6 mice. (a) Left, Photomicrograph shows immunolabeling for total ERK1/2, PDS95 (a marker of excitatory synapses), and a merge of the two (bar=1 μm for a,c,e). Arrows and arrowheads indicate single- and double-labeled elements, respectively. Right, both the number of ERK1/2 immunopositive (+) elements associated with PSD95 immunoreactivity (ir) (white bars) as well as the total number of ERK1/2+ elements (red bars) did not differ between B6 and BTBR mice (N⩾5/group; here and in B-F, BTBR values are presented as percent of mean values from B6 mice). (b), Left, representative western blots of hippocampal homogenates and forebrain synaptoneurosomal fractions (SNS) show comparable levels of ERK1/2-ir in samples from B6 and BTBR mice. Right, quantification of blot band densities, normalized to sample actin content, confirmed no effect of strain on total ERK1/2-ir in SNS (N⩾5/group). (c) Left, photomicrograph shows immunolabeling for phosphorylated (p-) ERK1/2 Thr202/Tyr204, PSD95, and a merge of the two. Right, quantification shows that in the CA1 stratum radiatum sample field, BTBR mice exhibit fewer PSD95+ contacts containing dense p-ERK1/2-ir than do B6 mice (**P<0.01), whereas total numbers of p-ERK1/2 immunoreactive elements were not different between strains (N⩾9/group). (d) Left, blots of hippocampal homogenates and forebrain SNS show levels of p-ERK1/2-ir and actin-ir in samples from B6 and BTBR mice. Right, densitometry of p-ERK1/2 immunoreactive bands (normalized to sample actin content) confirmed that SNS levels are lower in BTBR mice, as compared with B6s (*P<0.05; N⩾9/group). (e), Left, photomicrograph of immunolabeling for p-CREB Ser133, PSD95, and merged. Right, quantification of synapse-sized elements confirm that number of p-CREB+ PSDs in CA1 stratum radiatum is lower in BTBR as compared with B6 mice (**P<0.01), and that this difference was not seen for overall numbers of p-CREB+ puncta (N⩾9/group). (f) Left, blots of hippocampal homogenates and forebrain SNS show lower levels of p-CREB at synapses in BTBRs as compared with B6 mice; this was confirmed by blot densitometry (Right; N⩾9/group).

