Figure 1.
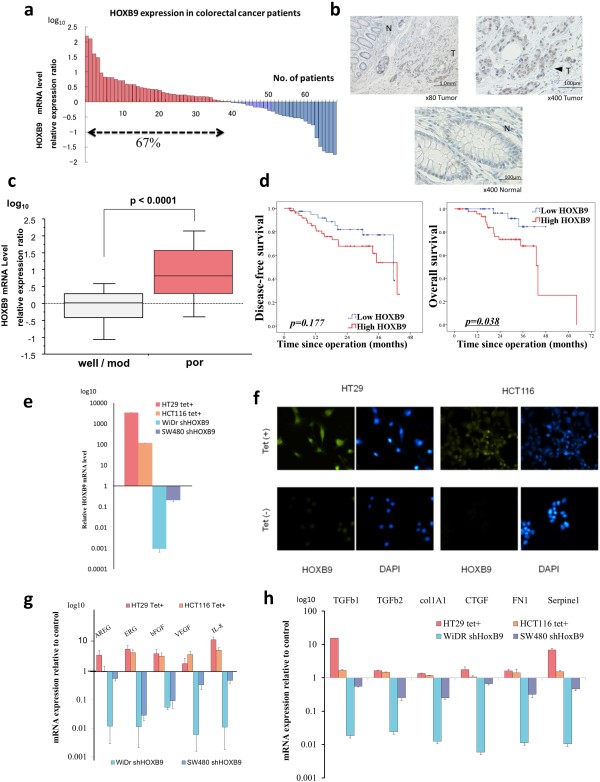
HOXB9 expression in colorectal cancer. (a) Waterfall plot of relative mRNA expression levels of HOXB9 in patients at the cancer site compared with those in normal mucosa (n = 69), determined using qRT-PCR in triplicate. (b) Immunohistochemical staining of HOXB9 in resected colorectal cancer specimens (T, tumor; N, normal mucosa). (c) Relative mRNA expression of HOXB9 in patients according to pathological differentiation (Well/ mod, well or moderately differentiated adenocarcinoma; Por, poorly differentiated adenocarcinoma). (d) Kaplan-Meier curves of colorectal cancer patients (n = 93), according to HOXB mRNA expression (Left panel, disease free survival; right panel, overall survival). (e) mRNA expression of HOXB9 determined by RT-PCR. (f) Immunocytochemistry of HOXB9-overexpressing cell lines. (g and h) mRNA expression of angiogenic factors (g) and TGF beta family (h) in HOXB9-overexpressing cell lines using RT-qPCR in triplicate. Error bars are SDs. P values by the log rank test. Scale bars, 100 μm.

