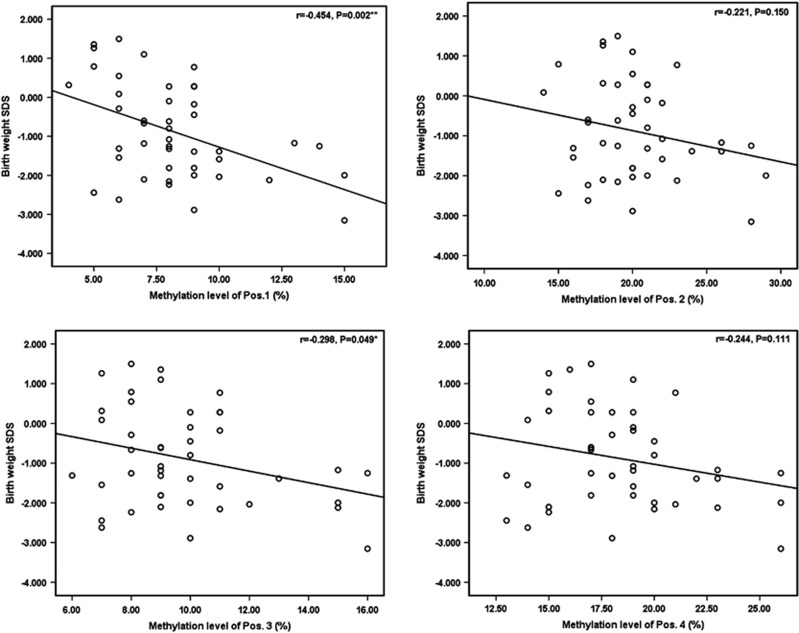
Figure 2.
Plots of the correlations between HSD11B2 methylation levels and newborn birth weight SDS. Scatterplots depict the correlation of HSD11B2 methylation levels (x axis) and newborn birth weight SDS, with the Pearson correlation coefficient (r) and associated P-value provided. Methylation levels of the first and the third CpG sites were significantly inversely associated with newborn birth weight SDS.

