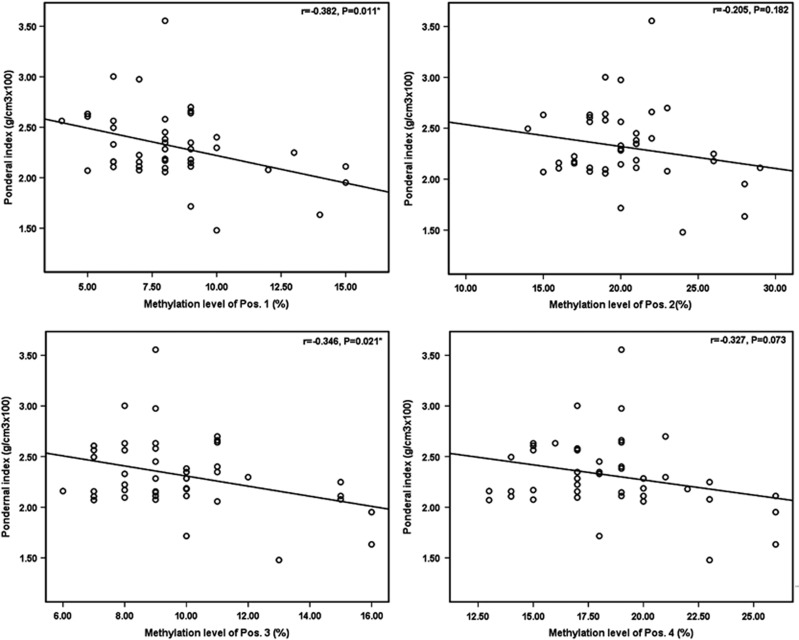
Figure 3.
Plots of the correlations between HSD11B2 methylation levels and newborn ponderal index. Scatterplots depict the correlation of HSD11B2 methylation level (x axis) and newborn ponderal index in g/cm3 × 100, with the Pearson correlation coefficient (r) and associated P-value provided. Methylation levels of the first and the third CpG site were significantly inversely associated with ponderal index at birth.

