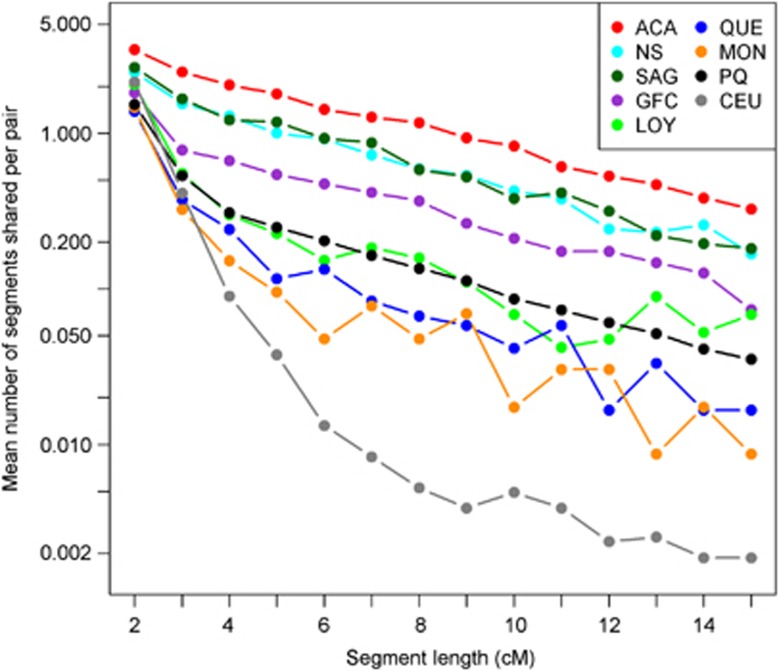
Figure 3.
Pairwise IBD sharing in each population. The mean number of segments shared is shown (y axis, log-scale) per pair for specific 1 cM class length ranging from 2–15 cM. ACA, Acadians, GFC, Gaspesian French Canadians; LOY, Loyalists; NS, North Shore; MON, Montreal; QUE, Quebec City area; SAG, Saguenay, PQ whole sample from the Province of Quebec, CEU HapMap.

