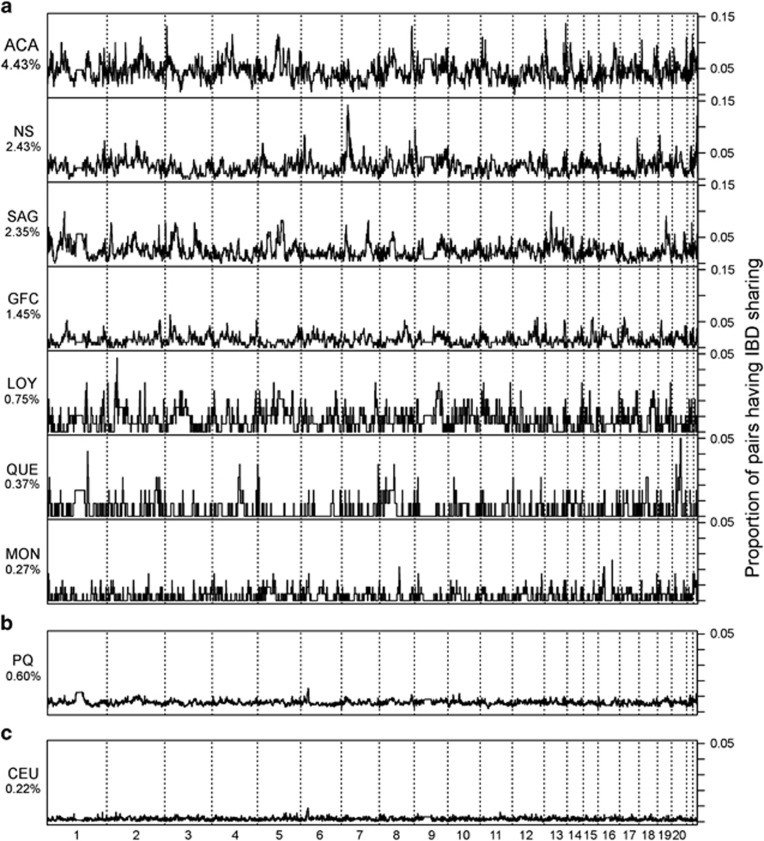
Figure 4.
Genome-wide patterns of IBD sharing in each population. The proportion of IBD sharing across the genome is shown for each population with vertical dashed lines to separate chromosomes and mean proportion of sharing indicated on the left. The proportion was calculated at each position that was genotyped in our data. Note that the scale is different for the first four graphs in panel (a). (a) Quebec populations: ACA, Acadians; GFC, Gaspesian French Canadians; LOY, Loyalists; NS, North Shore; MON, Montreal; QUE Quebec City area; SAG, Saguenay; (b) PQ whole sample from the Province of Quebec (c) CEU, HapMap.

