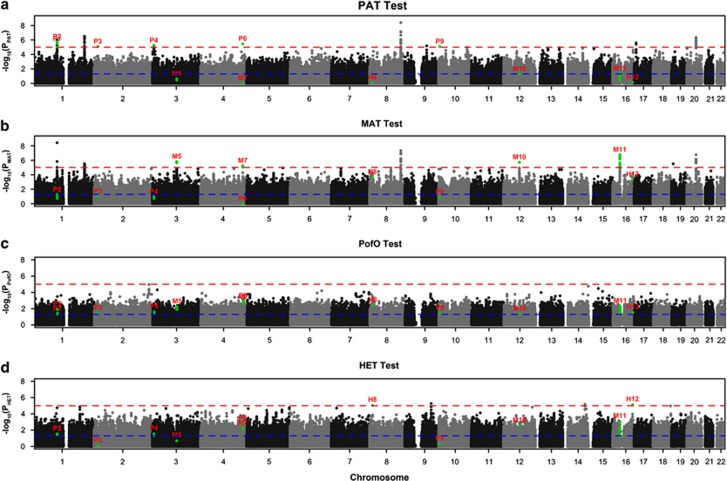
Figure 2.
Manhattan plot showing the results of four tests for 22 autosomes performed using all ethnic groups (Europeans and Asians) and disease subtypes (CL/P and CPO) combined. The y axis shows the −log10 P-value for each test and the red and blue lines represent thresholds of P<1 × 10⁻⁵ (suggestive association) and 0.05 (nominal significance), respectively. Green dots represent loci showing suggestive associations identified by the four tests (see Methods). Each locus is labeled based on the test showing P<1 × 10⁻⁵: P# for PAT, M# for MAT, PofO# for PofO test and H# for HET. The P-values generated by four tests for each locus are shown in all four panels using the same label. For example, all SNPs at M11 loci have P<10−5 in MAT (above red line), while the same SNPs show P>0.05 in PAT (below blue line). These SNPs show nominal significance in PofO and HET (between blue and red line).

