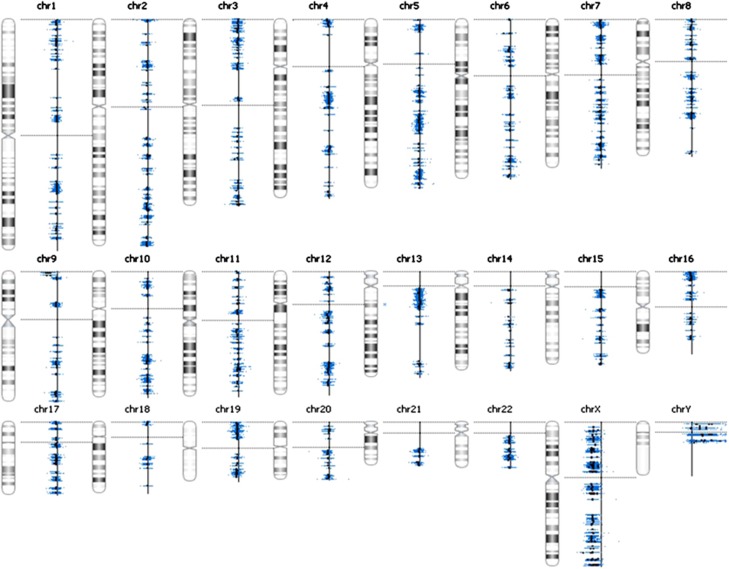
Figure 1.
Location of probes against a chromosome ideogram. The blue dots clustered around the black vertical line represent individual probes, with the vertical line representing the normal log2 ratio signal of 0. In this case the patient has a duplication of chromosome 9pter as seen by a shift to the left from the normal by the vertical cluster of probes at that region. In addition, the hybridization in this case is of a female child versus the father, as can be seen by a shift toward the left, signifying a gain, from the normal of all chromosome X probes and shift to the right from the normal, signifying a loss, of all chromosome Y probes.

