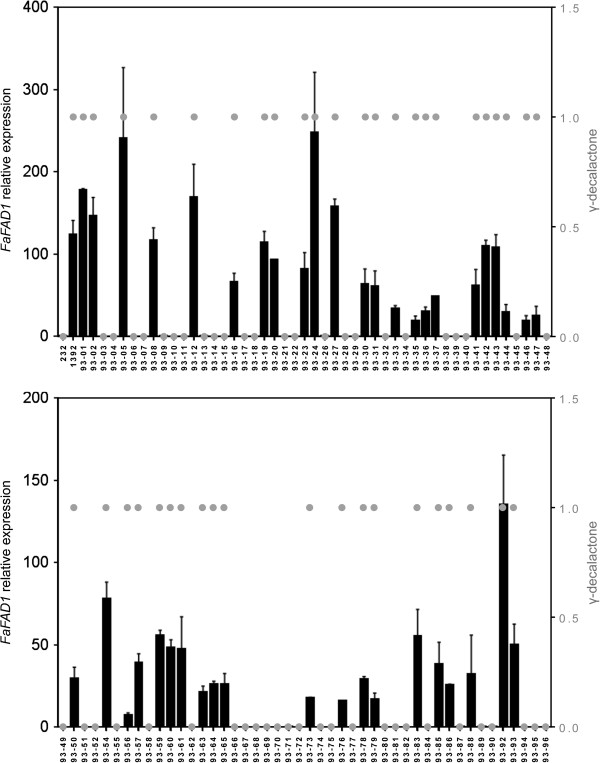
Figure 4.
Comparison of expression of FaFAD1 in the 232 × 1392 mapping population by real time qRT-PCR with γ-decalactone content in fruits. FaFAD1 expression (black bars) is expressed relative to the average expression in the population and it is indicated on the Y-axis to the left. The production of γ-decalactone scored as presence/absence (gray dots) is indicated on the Y-axis to the right.

