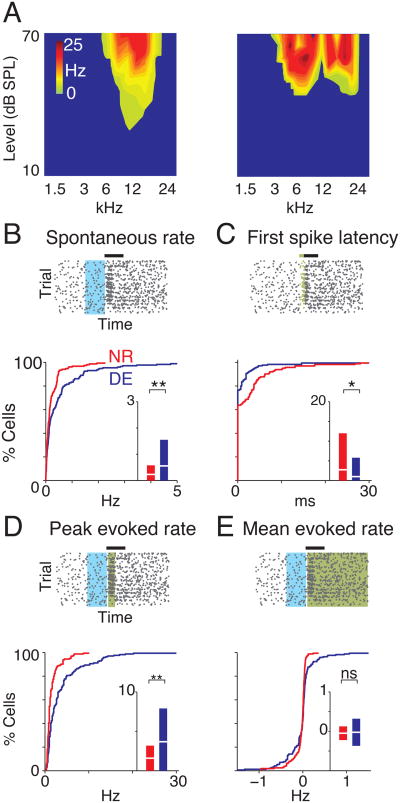
Figure 1.
Response characteristics of A1 neurons change after DE. (A) Representative FRAs showing increase in firing rate as a function of intensity of sound. Occasionally a multi-peaked response pattern (right) was observed. (B-E) Characterization of response properties. The top rasters indicate measurements for an example cell. Black horizontal bar indicates duration of sound (40 ms). Spontaneous rate is measured in blue area. Significant responses were first identified using Victor's binless method (Fig. S1) for estimating the stimulus-related information in the spike trains (Victor, 2002). This algorithm searches, via a sliding window (green), for significant neuronal responses within user-set limits of a response window (600 ms following onset of stimulus) and compares the observed spike rates within that window to those seen within a chosen window deemed to contain only spontaneous activity (200 ms preceding onset of stimulus, blue), while treating the latter as a Poisson process. Here, the size of the sliding window is inversely proportional to the temporal precision of recording spike-related information. (B) First spikes in each trial are indicated in green (C). Peak and mean rates are measured within the response window (identified by the binless algorithm, green areas in (D) and (E) respectively). Lower graphs show the distributions of the response properties between NR and DE cells (n = 173 and 175 respectively). Box plots indicate mean ± 95% confidence interval. ** and * indicate P <0.001and P <0.05 respectively. See also Fig. S1 and S2.

