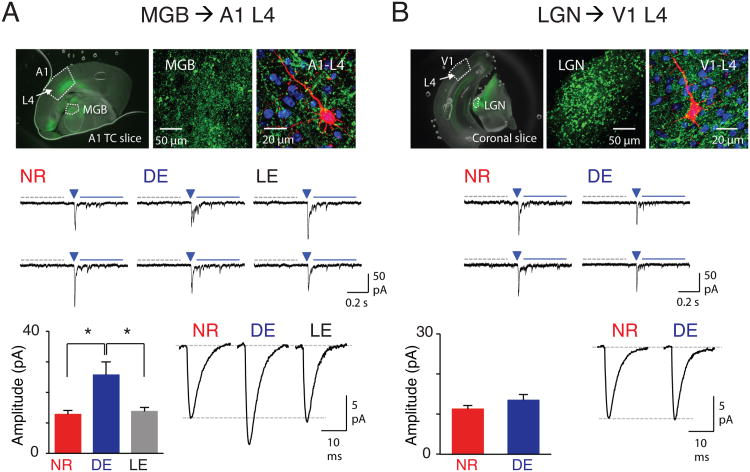
Figure 3.
Cross-modal potentiation of TC synapses in A1 without changes in V1. (A) Cross-modal regulation of TC-synapses in A1-L4. Top: AAV-ChR2-EYFP injection to MGB. Note expression of EYFP (green) in MGB (left and center panels). Top right: a biocytin-filled A1-L4 neuron (red) with DAPI (blue) and EYFP (green). Middle: Example traces of LEv-Sr2+-mEPSCs from NR, DE and LE group. A 5-ms duration LED light was delivered at the arrowhead to activate TC-synapses. Spontaneous events were collected during a 400-ms window (gray dotted line) before the LED, and LEv-Sr2+-mEPSCs were measured during a 400-ms window 50-ms after the LED (blue solid line). Bottom left: Average calculated LEv-Sr2+-mEPSC amplitude of thalamocortical inputs (see Supplemental Experimental Procedures). *P <0.04, ANOVA. Bottom right: Average raw LEv-Sr2+-mEPSC traces (without subtracting spontaneous events). (B) TC-synapses in V1-L4. Top: AAV-ChR2-EYFP injection to LGN. Note EYFP (green) in LGN (left and center panels). Top right: a biocytin-filled V1-L4 neuron (red) with DAPI (blue) and YFP (green). Middle: Example traces of LEv-Sr2+-mEPSCs. Marks are the same as in (A). Bottom left: Average calculated LEv-Sr2+-mEPSC amplitude of TC inputs. Bottom right: Average raw LEv-Sr2+-mEPSC traces. See Table S1 for data. See also Fig. S3.

