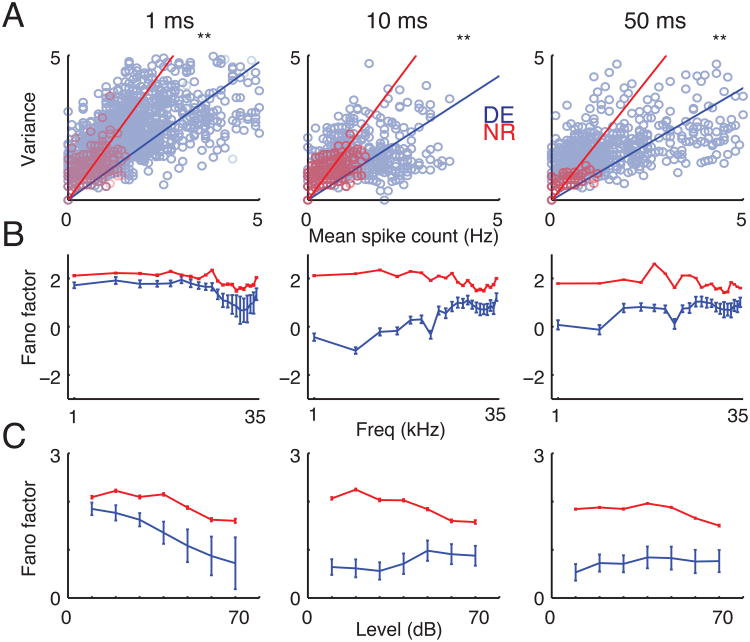
Figure 7.
(A) Variance of spike counts as function of mean spike counts at 3 different temporal resolutions. The ratio of variance and mean spike counts (Fano Factor; shown as slope of regression fit) is decreased after DE consistent with MI comparisons. (B, C) Fano Factor (ratio of variance and mean spike counts) at 3 different temporal resolutions. Consistent with MI comparisons, FF showed a significant overall decrease after DE when compared separately for frequencies (B) and sound levels (C) (P <0.05; t-test). Plotted are means ± s.d.

