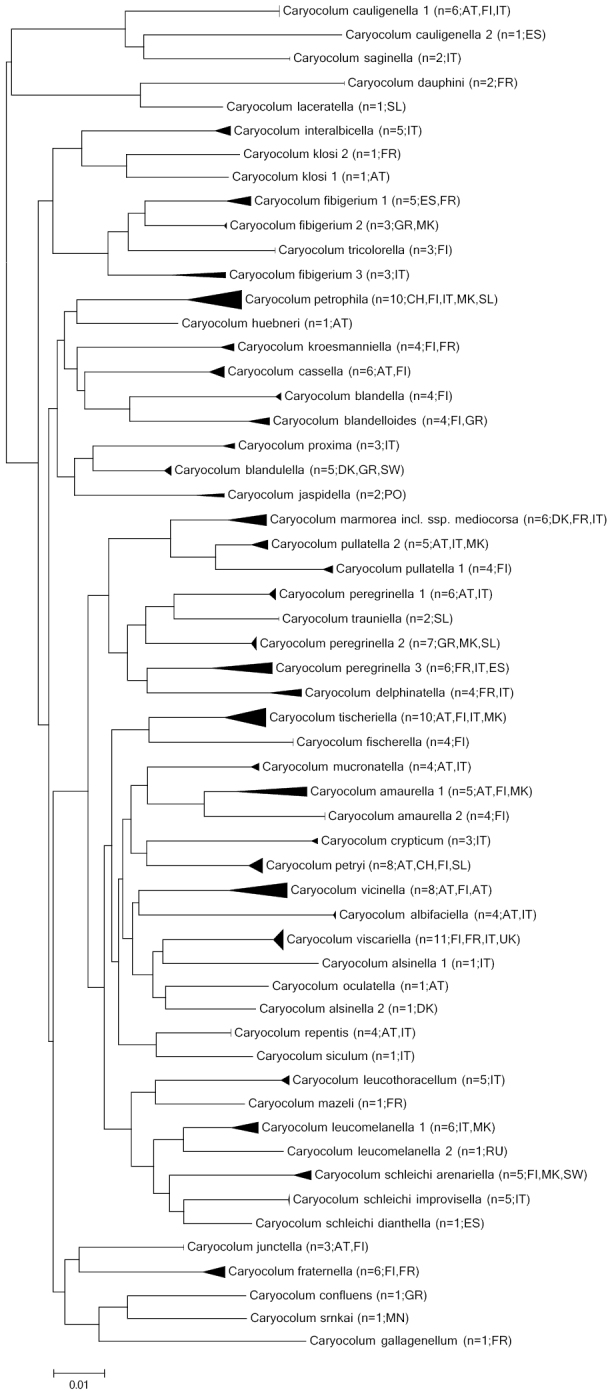
Figure 1.

Neighbour-joining tree (Kimura 2 parameter, built with MEGA 5; cf. Tamura et al. 2011), with only sequences longer than 500 bp considered. The width of the triangles represents the sample size, and the depth the genetic variation within the cluster. Currently recognized conspecific taxa with maximum divergence greater than 3% are shown as separate clades. Source: DNA Barcode data from BOLD (Barcode of Life Database, cf. Ratnasingham and Hebert 2007).
