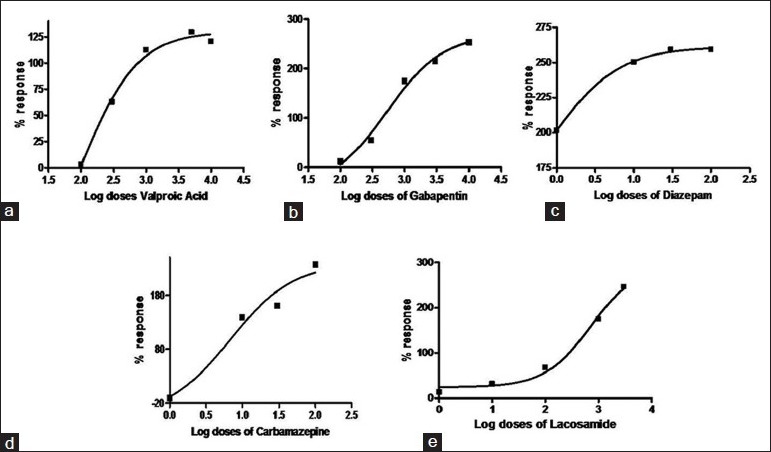
Fig. 2.

Dose-response curves illustrating % response in seizure latency at stage II
Dose-response curves of valproic acid (a), gabapentin (b), diazepam (c), carbamazepine (d) and lacosamide (e). EC50 values were calculated according to the method of Litchfield and Wilcoxon (1949). Dose regression curve were calculated using GraphPAD software
