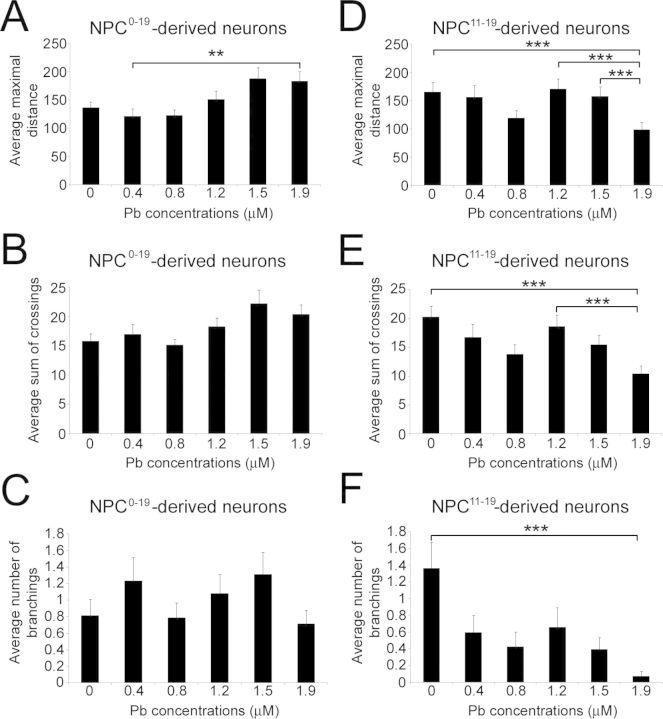
FIG. 6.
Neurons generated from control NPCs, NPC0–19 and NPC11–19, exhibit different morphologies at day 31 of the differentiation protocol. Histogram representing the average maximal distance reached by the longest neurites in neurons generated from NPC0–19 (A) and NPC11–19 (B) (paradigms C and D in Fig. 1A). Histogram representing the average sum of crossings in neurons generated from NPC0–19 (C) and NPC11–1 9 (D). Histogram representing the average number of branching in neurons generated from NPC0–19 (E) and NPC11–19 (F). Histogram values represent means ± SEM. Statistically significant difference (**p < 0.01; ***p ≤ 0.001; n = 3; one-way ANOVA) between Pb exposure and control conditions.

