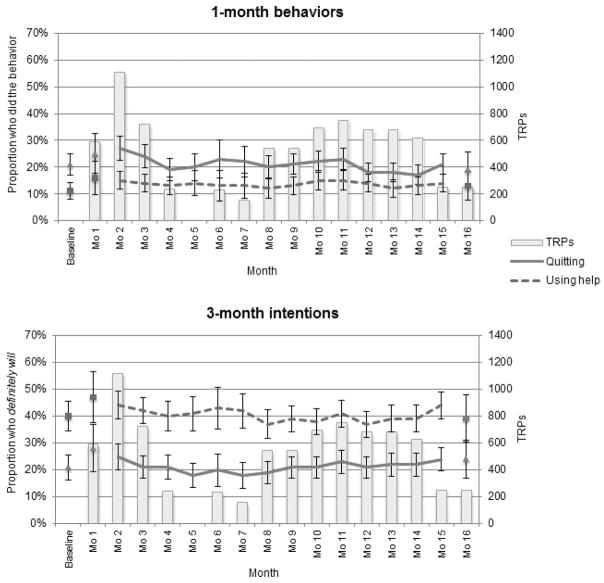
Figure 2.
Population-level effects of ad activity on quitting and using help: Philadelphia antismoking campaign, 2010–2012
Lines depict 3-month moving averages with CIs of ±2 SEs. Note that a moving average cannot be calculated for baseline, the first month, or the last month of the campaign period. Bars indicate the amount of campaign targeted rating points (TRPs) purchased each month (labeled on the right axis).

