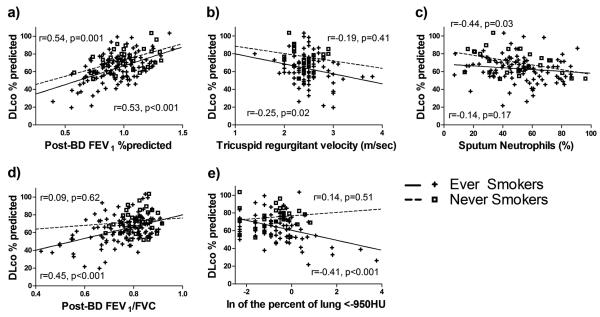
Figure 2.
Scatterplots and regression lines for DLCO % predicted by a) post-bronchodilator (BD) FEV1 % predicted, b) Tricuspid regurgitant velocity, c) sputum neutrophil percent, d) post-BD FEV1/FVC, and e) natural logarithm (ln) of the fraction of lung <-950 for ever smokers (positive symbols,+, and solid lines) and never smokers (open squares, □, and dashed lines). Pearson correlation coefficients (r) and significance values (p) are shown nearest to the regression lines of smokers (bottom) and never smokers (top) for correlations between the independent variable in each graph and DLCO % predicted.

