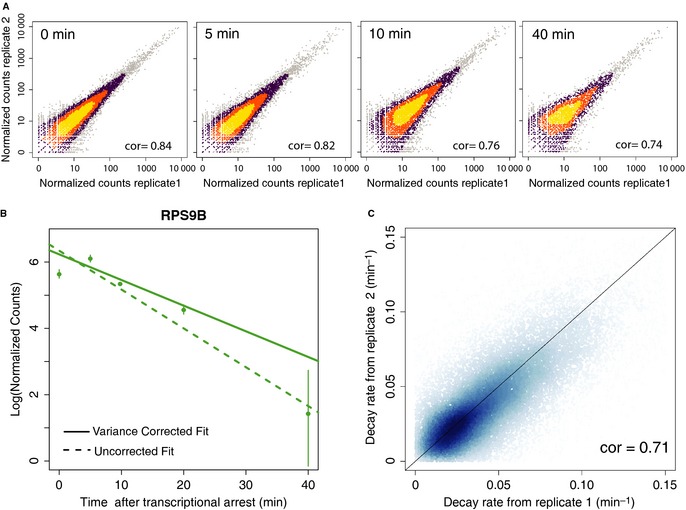
Figure 2. Accurate quantification of decay rates enabled by the use of weighted regression.

- Normalized sequencing counts per isoform from two biological replicates across the time points. Higher data density is represented by brighter colors. The increasing spread of counts at later time points (reflected by the decreasing Spearman correlation, cor) suggests an increase in the technical noise and the need for a weighted fitted scheme (see Supplementary Information).
- Estimation of decay rates for isoforms of the gene RPS9B using traditional regression (dashed line) vs. the variance‐corrected weighted regression used in this study (solid lines). The variance‐corrected fit results in a more conservative estimate of decay rates, while the uncorrected fit ignores the increased noise due to lower read counts typically observed at later timepoints and is thus more error‐prone (see Supplementary Fig S1B for more examples).
- Reproducibility of all 3′ isoforms mapped to genes in the yeast genome across both biological replicates. Higher data density is represented by darker colors.
