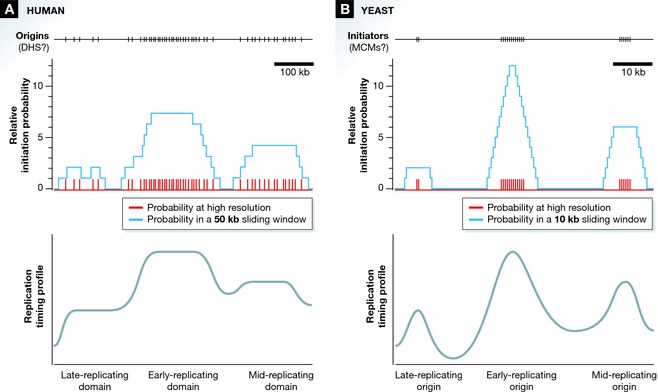
Figure 1. The effect of origin location on replication timing.

(A) The distribution of origins (which correlate with DNase I hypersensitive sites) across a region of a human chromosome is shown on top. The middle graph shows the probability of initiation at each origin, defined by Gindin et al as the “initiation probability landscape” (IPLS). In red, the firing probability at high resolution indicates that the probability is equal at all origins. In blue, the probability in a 50‐kb sliding window shows that a higher density of origins in early‐replicating domains leads to a much higher cumulative probability of origins firing in such domains. (B) A similar scenario has been proposed for yeast, albeit at higher resolution. The top line shows the distribution of hypothetical initiators (suggested to be MCM complexes) loaded at origins. As in (A), the cumulative probability (in a 10‐kb sliding window) of multiple initiators at early origins makes initiation at such origins more likely.
