
Figure 1.
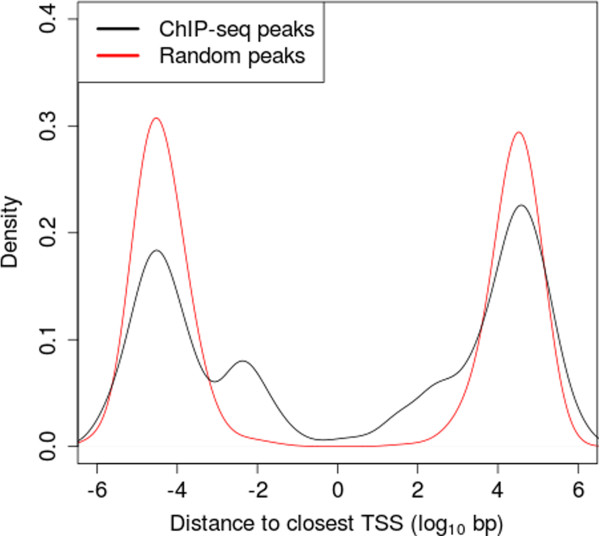
Distribution of NFIB ChIP-seq peaks relative to closest TSS. The black curve represents the distribution of the distances between the 759 NFIB ChIP-seq peaks and the closest TSS. Negative distances correspond to upstream peaks and positive distances to downstream peaks. The red curve shows the distances when the peaks are randomly and uniformly repositioned on their chromosomes. Density is estimated using a Gaussian kernel with bandwidth h=0.4.