
Figure 3.
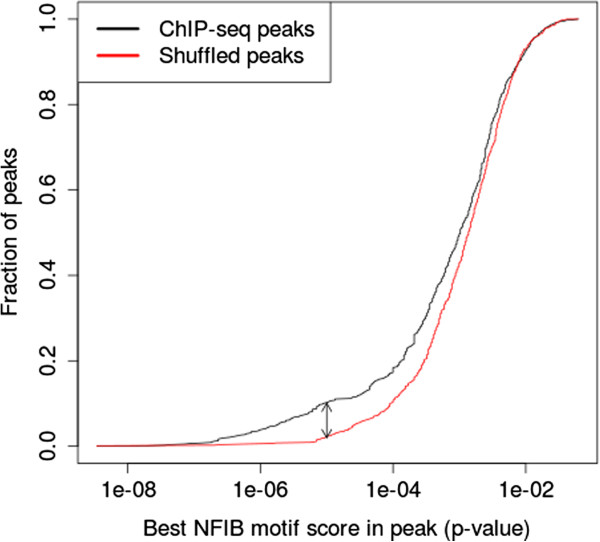
Enrichment of the NFIB motif in NFIB ChIP-seq peaks. The black curve shows the fraction of 759 ChIP-seq peaks with at least one predicted NFIB binding site using different motif score thresholds. The red curve shows distribution obtained when each ChIP-seq peak region is shuffled while preserving trinucleotide frequencies.