
Figure 4.
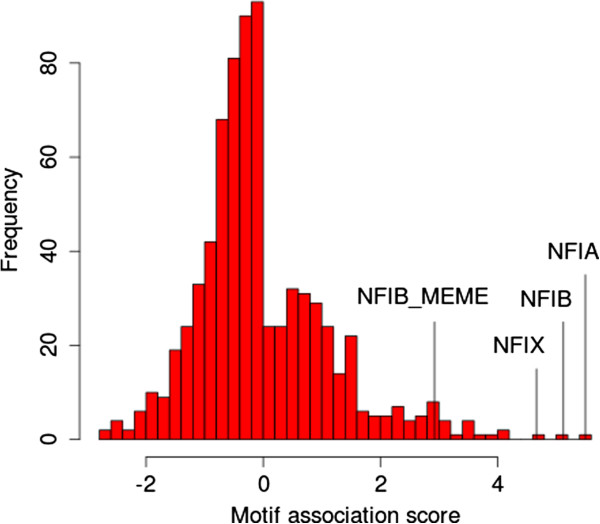
Motif Association Score distribution for Nfib targets. The histogram shows the distribution of the MAS for the 739 motifs in the compendium (our ChIP-seq motif inferred with MEME (Nfib_MEME) plus 738 mouse and human TF motifs determined by SELEX [14]).