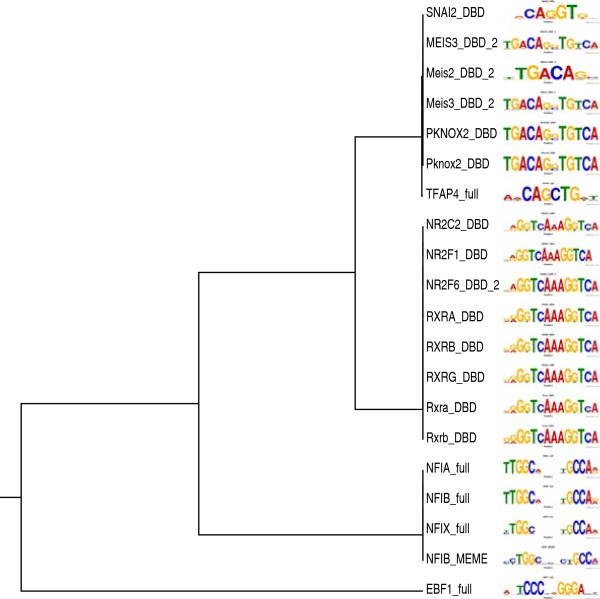
Figure 5.
Motifs associated with dysregulated genes in Nfib-KO mouse clustered by motif similarity. The tree shows the top 20 motifs according to MAS clustered using the Pearson Correlation Coefficient to measure the similarity between pairs of motifs, and the UPGMA tree-building algorithm to create the tree [20]. The tree was drawn using Phylodendron [21].

