
Figure 6.
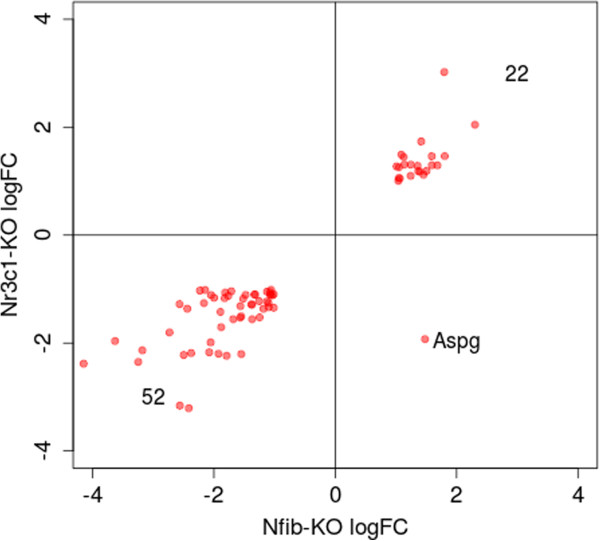
Expression change of genes activated/repressed in both Nfib-KO and Nr3c1-KO mice is highly correlated. Each point represents a gene activated/repressed in both knockouts. Expression change is expressed as log2(KO/WT), and only genes with a 2-fold change and a q-value less than 0.05 in both knockouts are shown.