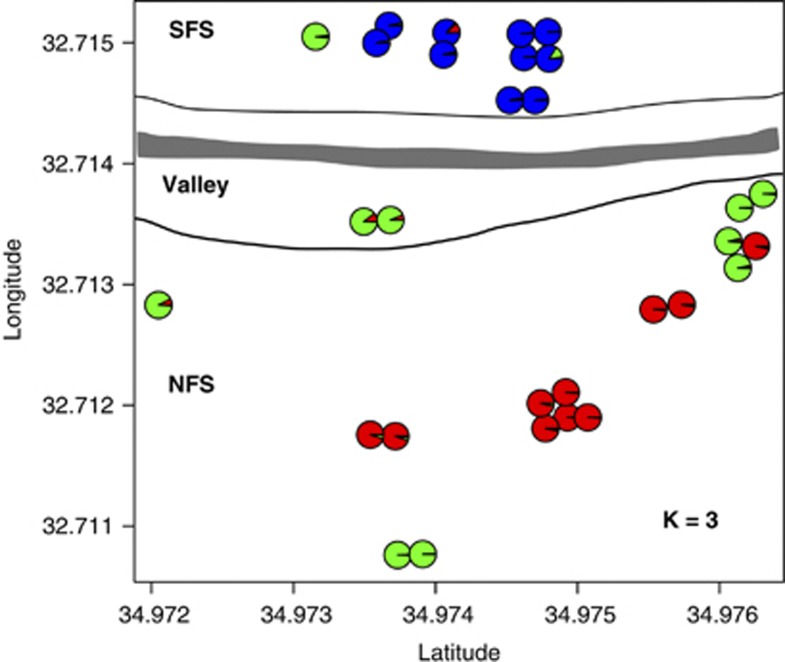
Figure 4.
Spatial distribution of accessions in EC1 based on their Global Positioning System (GPS) coordinates and the STRUCTURE analysis with K=3. The pie diagram indicates the relative proportion to which each of the three accessions was assigned proportionally to one of the three clusters. The line of dashes outlines the area of the valley bottom, and the gray line shows the road crossing through EC1. A full color version of this figure is available at the Heredity journal online.

