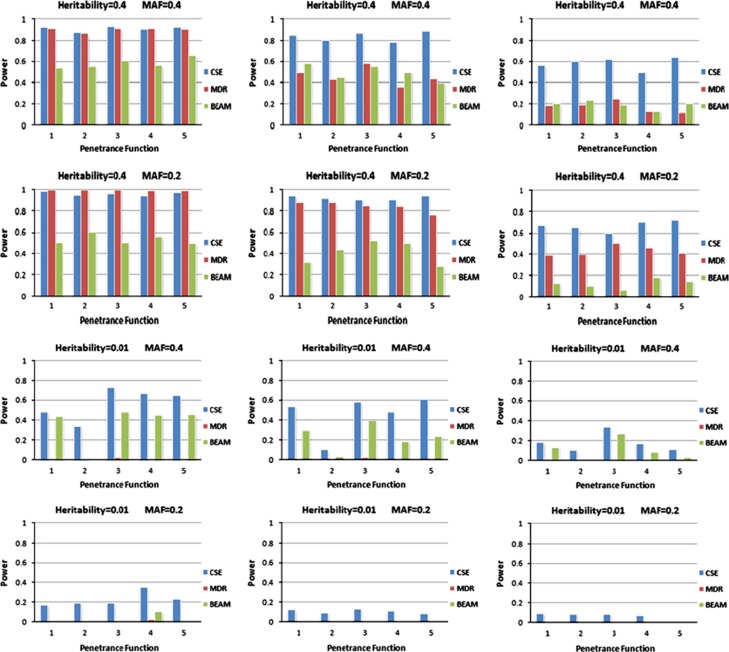
Figure 5.
Powers obtained by three epistasis detection methods (CSE, MDR and BEAM) on synthetic data containing two interacting SNPs. The figure gives the power of the methods for three sample sizes of 1600, 800 and 400 with equal numbers of cases and controls. For each sample size, 20 penetrance functions with two MAFs and two heritability levels are examined. For each penetrance model, 100 data sets with 1000 SNPs are examined. The highest scoring interactions were evaluated using CSE, MDR and BEAM for each data set. Finally, the power was estimated as the number of correctly detected interacting SNPs divided by the number of SNPs in the data set.

